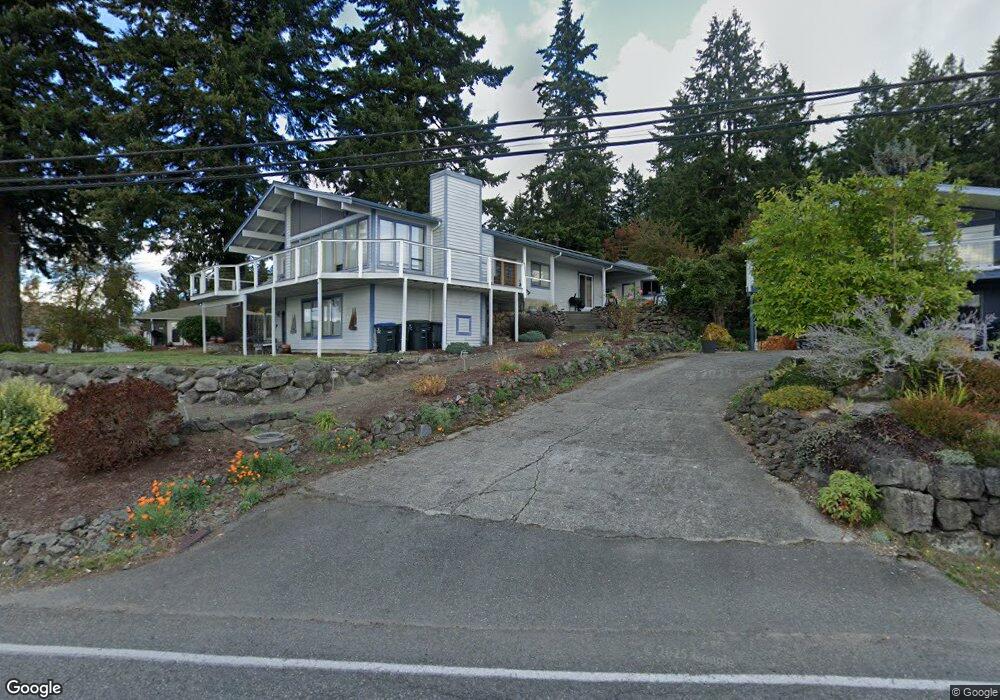
17750 Fjord Dr NE Poulsbo, WA 98370
Estimated Value: $870,000 - $1,366,743
4
Beds
3
Baths
1,800
Sq Ft
$621/Sq Ft
Est. Value
About This Home
This home is located at 17750 Fjord Dr NE, Poulsbo, WA 98370 and is currently estimated at $1,117,936, approximately $621 per square foot. 17750 Fjord Dr NE is a home with nearby schools including Poulsbo Elementary School, Poulsbo Middle School, and North Kitsap High School.
Ownership History
Date
Name
Owned For
Owner Type
Purchase Details
Closed on
Dec 2, 2021
Sold by
Mumm Alan Homer
Bought by
Santiago Brandon
Current Estimated Value
Home Financials for this Owner
Home Financials are based on the most recent Mortgage that was taken out on this home.
Original Mortgage
$500,000
Outstanding Balance
$459,746
Interest Rate
3.09%
Mortgage Type
New Conventional
Estimated Equity
$658,190
Purchase Details
Closed on
Aug 2, 2021
Sold by
Jane Mumm Betty and Estate Of Betty Jane Mumm
Bought by
Heil Caroline A
Purchase Details
Closed on
Aug 1, 1995
Sold by
Utheim Larry J and Utheim Pamela J
Bought by
Mumm Alan Homer and Mumm Betty J C
Home Financials for this Owner
Home Financials are based on the most recent Mortgage that was taken out on this home.
Original Mortgage
$250,000
Interest Rate
7.61%
Create a Home Valuation Report for This Property
The Home Valuation Report is an in-depth analysis detailing your home's value as well as a comparison with similar homes in the area
Home Values in the Area
Average Home Value in this Area
Purchase History
| Date | Buyer | Sale Price | Title Company |
|---|---|---|---|
| Santiago Brandon | $800,000 | Pacific Northwest Ttl Silver | |
| Heil Caroline A | $313 | None Listed On Document | |
| Mumm Alan Homer | $284,000 | Transamerica Title Ins Co |
Source: Public Records
Mortgage History
| Date | Status | Borrower | Loan Amount |
|---|---|---|---|
| Open | Santiago Brandon | $500,000 | |
| Previous Owner | Mumm Alan Homer | $250,000 |
Source: Public Records
Tax History Compared to Growth
Tax History
| Year | Tax Paid | Tax Assessment Tax Assessment Total Assessment is a certain percentage of the fair market value that is determined by local assessors to be the total taxable value of land and additions on the property. | Land | Improvement |
|---|---|---|---|---|
| 2026 | $11,629 | $1,296,190 | $438,000 | $858,190 |
| 2025 | $11,629 | $1,296,190 | $438,000 | $858,190 |
| 2024 | $11,435 | $1,312,420 | $443,810 | $868,610 |
| 2023 | $9,760 | $1,101,350 | $403,030 | $698,320 |
| 2022 | $8,572 | $919,770 | $335,860 | $583,910 |
| 2021 | $7,423 | $738,170 | $268,680 | $469,490 |
| 2020 | $6,771 | $661,500 | $239,900 | $421,600 |
| 2019 | $6,772 | $661,500 | $239,900 | $421,600 |
| 2018 | $6,994 | $602,030 | $178,280 | $423,750 |
| 2017 | $6,917 | $602,030 | $178,280 | $423,750 |
| 2016 | $7,276 | $583,400 | $178,280 | $405,120 |
| 2015 | $6,139 | $494,750 | $162,070 | $332,680 |
| 2014 | -- | $432,650 | $162,070 | $270,580 |
| 2013 | -- | $432,650 | $162,070 | $270,580 |
Source: Public Records
Map
Nearby Homes
- 0 XX Lemolo Shore Dr NE
- 17667 State Highway 305 NE
- 18330 9th Ave NE
- 1610 NE Mount Kamela Ct
- 18664 11th Ave NE
- 17787 Sunrise Ridge Ave NE
- 18130 Sunrise Ridge Ave NE
- 17915 Sunrise Ridge Ave NE
- 18637 Fjord Dr NE
- 18552 15th Loop NE
- 18323 Sunrise Ridge Ave NE
- Asher Plan at Liberty Bay Vista
- Rainier Plan at Liberty Bay Vista
- Raymond Plan at Liberty Bay Vista
- Luna Plan at Liberty Bay Vista
- Luna (Basement) Plan at Liberty Bay Vista
- Warren Plan at Liberty Bay Vista
- Noah Plan at Liberty Bay Vista
- Noah (Basement) Plan at Liberty Bay Vista
- Bennett (Basement) Plan at Liberty Bay Vista
- 17736 Fjord Dr NE
- 17780 9th Ave NE
- 924 NE Holm Ct
- 922 NE Holm Ct
- 960 NE Holm Ct
- 17833 Enden Place NE
- 17830 9th Ave NE
- 963 NE Holm Ct
- 17811 9th Ave NE
- 17830 Enden Place NE
- 1002 NE Holm Ct
- 997 NE Holm Ct
- 17857 Enden Place NE
- 17770 9th Ave NE
- 17831 9th Ave NE
- 17860 9th Ave NE
- 977 NE Holm Ct
- 1020 NE Holm Ct
- 17860 Enden Place NE
- 17749 Fjord Dr NE