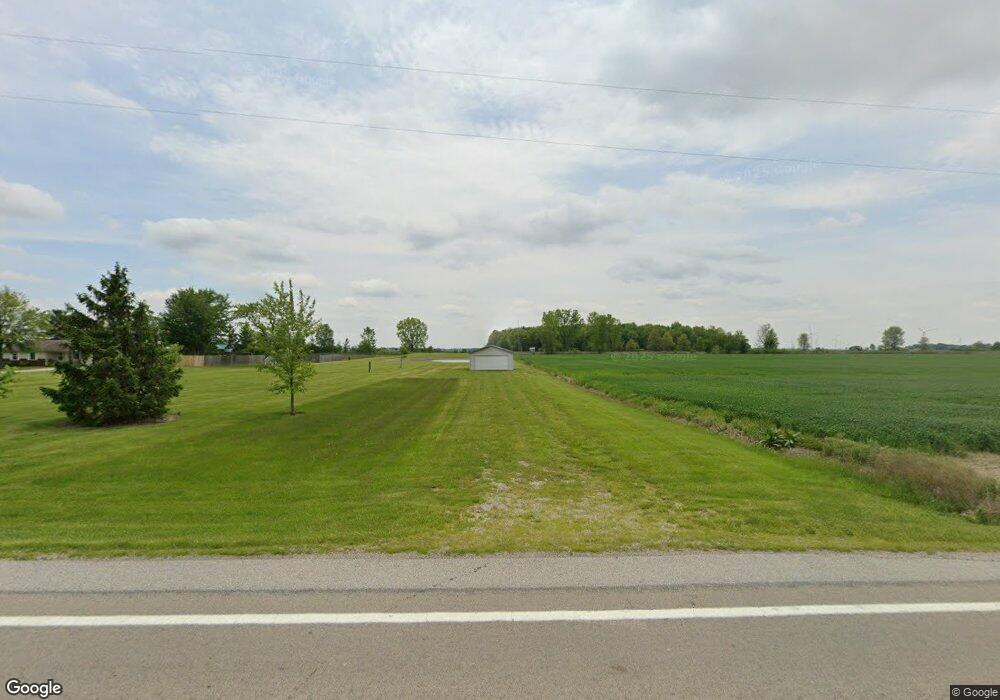
17758 State Route 613 Paulding, OH 45879
Estimated Value: $84,000 - $234,383
2
Beds
1
Bath
840
Sq Ft
$168/Sq Ft
Est. Value
About This Home
This home is located at 17758 State Route 613, Paulding, OH 45879 and is currently estimated at $141,096, approximately $167 per square foot. 17758 State Route 613 is a home located in Paulding County with nearby schools including Wayne Trace High School.
Ownership History
Date
Name
Owned For
Owner Type
Purchase Details
Closed on
Aug 20, 2015
Sold by
Chapman Earl H and Chapman Jan C
Bought by
Brandt Joy C and Font Julie A
Current Estimated Value
Purchase Details
Closed on
Nov 21, 2014
Sold by
Averesch Douglas A and Averesch Denise J
Bought by
Chapman Earl H and Chapman Jan C
Purchase Details
Closed on
Nov 10, 2010
Sold by
Strawter William H and Strawter Debra A
Bought by
Averesch Douglas A
Home Financials for this Owner
Home Financials are based on the most recent Mortgage that was taken out on this home.
Original Mortgage
$21,250
Interest Rate
6.25%
Mortgage Type
Future Advance Clause Open End Mortgage
Purchase Details
Closed on
Jun 4, 2009
Sold by
Saylor Brian L and Saylor Beverly S
Bought by
Strawter William H and Strawter Debra A
Purchase Details
Closed on
May 8, 2007
Sold by
Mcgrath William H
Bought by
Saylor Brian L and Saylor Beverly S
Purchase Details
Closed on
Mar 8, 1991
Bought by
Chapman Earl H Le and Chapman Jan C L
Create a Home Valuation Report for This Property
The Home Valuation Report is an in-depth analysis detailing your home's value as well as a comparison with similar homes in the area
Purchase History
| Date | Buyer | Sale Price | Title Company |
|---|---|---|---|
| Brandt Joy C | -- | None Available | |
| Chapman Earl H | $110,000 | None Available | |
| Averesch Douglas A | $25,000 | None Available | |
| Strawter William H | $43,500 | None Available | |
| Saylor Brian L | $25,000 | None Available | |
| Chapman Earl H Le | $21,000 | -- |
Source: Public Records
Mortgage History
| Date | Status | Borrower | Loan Amount |
|---|---|---|---|
| Previous Owner | Averesch Douglas A | $21,250 | |
| Previous Owner | Averesch Douglas A | $3,750 |
Source: Public Records
Tax History
| Year | Tax Paid | Tax Assessment Tax Assessment Total Assessment is a certain percentage of the fair market value that is determined by local assessors to be the total taxable value of land and additions on the property. | Land | Improvement |
|---|---|---|---|---|
| 2024 | $475 | $10,790 | $8,860 | $1,930 |
| 2023 | $386 | $10,790 | $8,860 | $1,930 |
| 2022 | $368 | $10,790 | $8,860 | $1,930 |
| 2021 | $420 | $10,930 | $8,860 | $2,070 |
| 2020 | $433 | $10,930 | $8,860 | $2,070 |
| 2019 | $436 | $10,820 | $8,860 | $1,960 |
| 2018 | $396 | $10,820 | $8,860 | $1,960 |
| 2017 | $397 | $10,820 | $8,860 | $1,960 |
| 2016 | $386 | $10,820 | $8,860 | $1,960 |
| 2015 | $542 | $15,540 | $9,590 | $5,950 |
| 2014 | $549 | $15,540 | $9,590 | $5,950 |
| 2013 | $731 | $17,220 | $9,590 | $7,630 |
Source: Public Records
Map
Nearby Homes
- 17727 State Route 613
- 17794 State Route 613
- 17982 State Route 613
- 7817 State Route 637
- 17417 State Route 613
- 17196 State Route 613
- 8610 State Route 637
- 8610 State Route 637
- 7269 State Route 637
- 7269 Ohio 637
- 7836 Road 137
- 8063 Road 137
- 16981 Rd 72
- 7572 Road 137
- 8652 Road 137
- 16918 Road 100
- 8602 Road 137