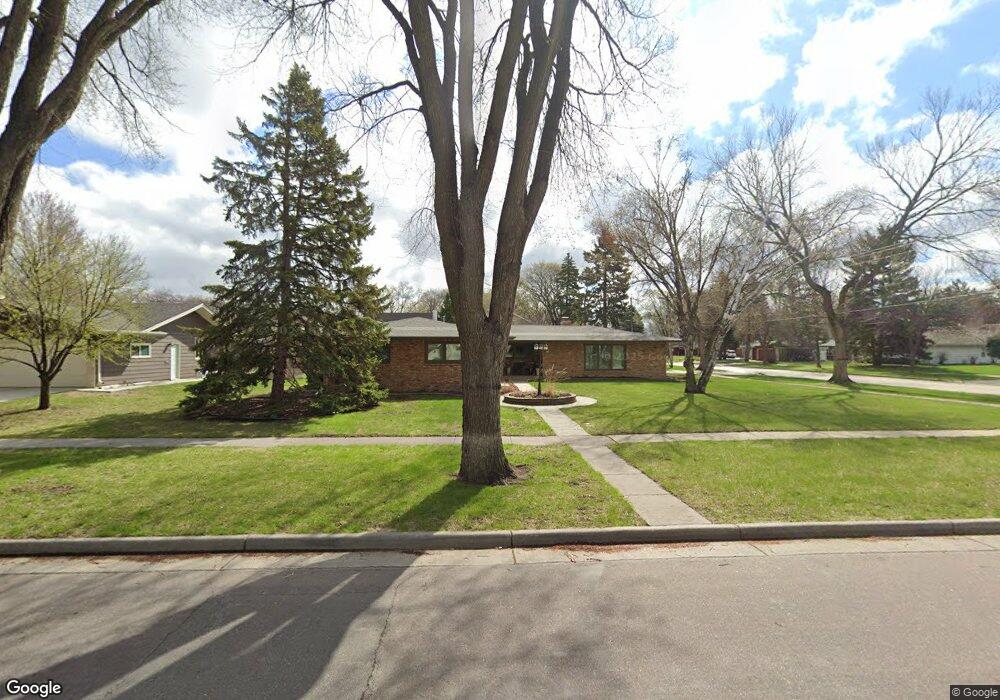
1776 8th St S Fargo, ND 58103
Clara Barton NeighborhoodEstimated Value: $365,000 - $616,000
3
Beds
3
Baths
3,000
Sq Ft
$182/Sq Ft
Est. Value
About This Home
This home is located at 1776 8th St S, Fargo, ND 58103 and is currently estimated at $545,185, approximately $181 per square foot. 1776 8th St S is a home located in Cass County with nearby schools including Clara Barton Elementary School, Carl Ben Eielson Middle School, and South High School.
Ownership History
Date
Name
Owned For
Owner Type
Purchase Details
Closed on
Jul 28, 2015
Sold by
Noah Paul J and Noah Geneva L
Bought by
Nielsen William D and Nielsen Michelle K
Current Estimated Value
Home Financials for this Owner
Home Financials are based on the most recent Mortgage that was taken out on this home.
Original Mortgage
$322,500
Outstanding Balance
$240,844
Interest Rate
2.62%
Mortgage Type
Adjustable Rate Mortgage/ARM
Estimated Equity
$304,341
Purchase Details
Closed on
Oct 14, 2010
Sold by
Noah Paul J and Noah Geneva L
Bought by
Noah Paul J and Noah Geneva L
Home Financials for this Owner
Home Financials are based on the most recent Mortgage that was taken out on this home.
Original Mortgage
$190,000
Interest Rate
3.74%
Mortgage Type
New Conventional
Create a Home Valuation Report for This Property
The Home Valuation Report is an in-depth analysis detailing your home's value as well as a comparison with similar homes in the area
Home Values in the Area
Average Home Value in this Area
Purchase History
| Date | Buyer | Sale Price | Title Company |
|---|---|---|---|
| Nielsen William D | $433,000 | Northern Title Co | |
| Noah Paul J | -- | -- |
Source: Public Records
Mortgage History
| Date | Status | Borrower | Loan Amount |
|---|---|---|---|
| Open | Nielsen William D | $322,500 | |
| Previous Owner | Noah Paul J | $190,000 |
Source: Public Records
Tax History Compared to Growth
Tax History
| Year | Tax Paid | Tax Assessment Tax Assessment Total Assessment is a certain percentage of the fair market value that is determined by local assessors to be the total taxable value of land and additions on the property. | Land | Improvement |
|---|---|---|---|---|
| 2024 | $8,397 | $293,800 | $46,250 | $247,550 |
| 2023 | $8,343 | $274,600 | $46,250 | $228,350 |
| 2022 | $7,726 | $247,400 | $46,250 | $201,150 |
| 2021 | $8,096 | $265,900 | $55,450 | $210,450 |
| 2020 | $8,003 | $265,900 | $55,450 | $210,450 |
| 2019 | $7,551 | $248,500 | $34,650 | $213,850 |
| 2018 | $7,465 | $248,500 | $34,650 | $213,850 |
| 2017 | $7,209 | $241,250 | $34,650 | $206,600 |
| 2016 | $6,529 | $234,200 | $34,650 | $199,550 |
| 2015 | $5,745 | $188,400 | $23,550 | $164,850 |
| 2014 | $5,507 | $174,450 | $23,550 | $150,900 |
| 2013 | $5,821 | $174,450 | $23,550 | $150,900 |
Source: Public Records
Map
Nearby Homes
- 1439 10th St S
- 1550 13 1 2 St S
- 1710 14th St S
- 1361 16th Ave S
- 1425 11th St S
- 2309 9th St S
- 337 Elmwood Ave S
- 1834 14 1 2 St S
- 1550 14 1 2 St S
- 1718 15th St S
- 1301 10th St S
- 1545 15th St S
- 1410 14 1 2 St S
- 1208 University Dr S
- 1314 14th St S
- 1405 25th Ave S Unit A201
- 2440 15th St S Unit B14
- 1124 University Dr S
- 1917 16 1 2 St S
- 1112 University Dr S