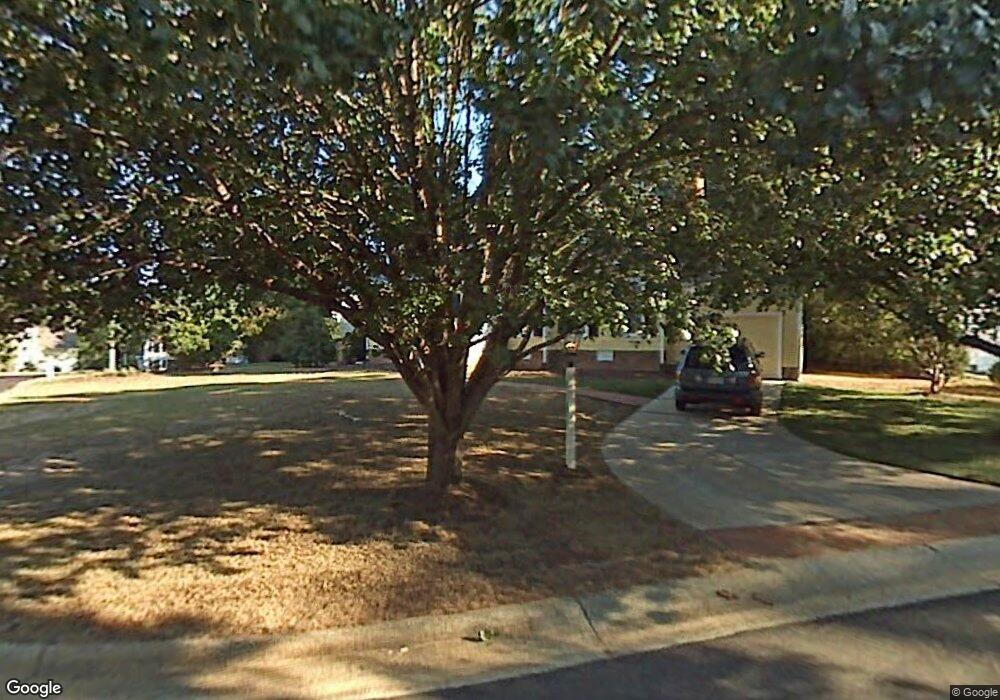
1776 Dunmore Place Chapel Hill, NC 27517
Estimated Value: $604,000 - $645,000
4
Beds
3
Baths
2,668
Sq Ft
$232/Sq Ft
Est. Value
About This Home
This home is located at 1776 Dunmore Place, Chapel Hill, NC 27517 and is currently estimated at $618,559, approximately $231 per square foot. 1776 Dunmore Place is a home located in Durham County with nearby schools including Creekside Elementary School, Morehead Montessori, and Sherwood Githens Middle.
Ownership History
Date
Name
Owned For
Owner Type
Purchase Details
Closed on
Jan 1, 2020
Sold by
Hazen Thomas L and Hazen Lisa L
Bought by
230 East Winmore Llc
Current Estimated Value
Purchase Details
Closed on
Mar 22, 2016
Sold by
Hazen George Titus
Bought by
Hazen Thomas L and Hazen Lisa L
Purchase Details
Closed on
Jul 8, 2011
Sold by
Spears George E
Bought by
Hazen George Titus
Purchase Details
Closed on
Dec 30, 2009
Sold by
Tyndall Thomas Matthew and Tyndall Robin Schafer
Bought by
Spears George E
Purchase Details
Closed on
Sep 25, 1998
Sold by
Tegnell Gordon E and Tegnell Evelyn F
Bought by
Tyndall Thomas Matthew and Tyndall Robin Schafer
Home Financials for this Owner
Home Financials are based on the most recent Mortgage that was taken out on this home.
Original Mortgage
$207,000
Interest Rate
6.96%
Create a Home Valuation Report for This Property
The Home Valuation Report is an in-depth analysis detailing your home's value as well as a comparison with similar homes in the area
Home Values in the Area
Average Home Value in this Area
Purchase History
| Date | Buyer | Sale Price | Title Company |
|---|---|---|---|
| 230 East Winmore Llc | -- | None Available | |
| Hazen Thomas L | $357,000 | -- | |
| Hazen George Titus | -- | None Available | |
| Spears George E | $325,500 | None Available | |
| Tyndall Thomas Matthew | $230,000 | -- |
Source: Public Records
Mortgage History
| Date | Status | Borrower | Loan Amount |
|---|---|---|---|
| Previous Owner | Tyndall Thomas Matthew | $207,000 |
Source: Public Records
Tax History Compared to Growth
Tax History
| Year | Tax Paid | Tax Assessment Tax Assessment Total Assessment is a certain percentage of the fair market value that is determined by local assessors to be the total taxable value of land and additions on the property. | Land | Improvement |
|---|---|---|---|---|
| 2025 | $5,672 | $572,170 | $166,375 | $405,795 |
| 2024 | $4,689 | $336,167 | $72,600 | $263,567 |
| 2023 | $4,403 | $336,167 | $72,600 | $263,567 |
| 2022 | $4,303 | $336,167 | $72,600 | $263,567 |
| 2021 | $4,282 | $336,167 | $72,600 | $263,567 |
| 2020 | $4,182 | $336,167 | $72,600 | $263,567 |
| 2019 | $4,182 | $336,167 | $72,600 | $263,567 |
| 2018 | $4,143 | $305,427 | $69,575 | $235,852 |
| 2017 | $4,113 | $305,427 | $69,575 | $235,852 |
| 2016 | $3,974 | $305,427 | $69,575 | $235,852 |
| 2015 | $4,492 | $324,478 | $65,470 | $259,008 |
| 2014 | $4,492 | $324,478 | $65,470 | $259,008 |
Source: Public Records
Map
Nearby Homes
- 1233 Cranebridge Place
- 1219 Cranebridge Place
- 1002 Kingswood Dr Unit H
- 1010 Kingswood Dr Unit G
- 108 Littlejohn Rd Unit B
- 47 Abernathy Dr Unit 13
- 165 Springberry Ln Unit 165
- 167 Springberry Ln Unit 167
- 245 N Crest Dr
- 6724 Glen Forrest Dr
- 380 Summerwalk Cir Unit 380
- 249 Summerwalk Cir
- 3 Peaceful Place
- 1 Vauxhall Place
- 2 Vauxhall Place Unit 48
- 2204 Ridgefield Dr
- 143 Manordale Dr
- 112 Weaver Mine Trail
- 6507 Glen Forrest Dr
- 309 Crossland Dr
- 1202 Killington Ct
- 1774 Dunmore Place
- 1778 Dunmore Place
- 1773 Dunmore Place
- 1775 Dunmore Place
- 1204 Killington Ct
- 1833 Chedworth Ct
- 1835 Chedworth Ct
- 1780 Dunmore Place
- 1203 Killington Ct
- 1777 Dunmore Place
- 1208 Killington Ct
- 1 Forest Glen Dr Unit 24
- 1 Forest Glen Dr Unit 23
- 1 Forest Glen Dr Unit 22
- 1 Forest Glen Dr Unit 21
- 1 Forest Glen Dr Unit 20
- 1 Forest Glen Dr Unit 19
- 1 Forest Glen Dr Unit 18
- 1 Forest Glen Dr Unit 17