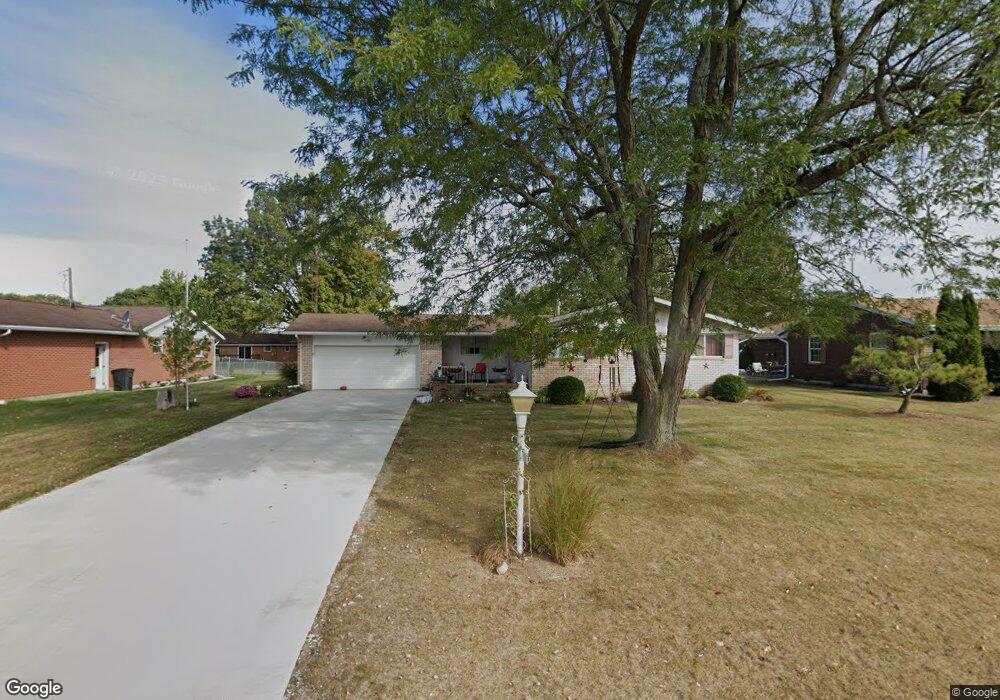
1776 Green Way Marion, OH 43302
Estimated Value: $233,822 - $262,000
3
Beds
2
Baths
1,353
Sq Ft
$185/Sq Ft
Est. Value
About This Home
This home is located at 1776 Green Way, Marion, OH 43302 and is currently estimated at $249,706, approximately $184 per square foot. 1776 Green Way is a home located in Marion County with nearby schools including River Valley High School, Marion Preparatory Academy, and Rushmore Academy.
Ownership History
Date
Name
Owned For
Owner Type
Purchase Details
Closed on
Dec 30, 2014
Bought by
Ballinger Larry P & Cynthia J K Trustees
Current Estimated Value
Purchase Details
Closed on
Oct 7, 2011
Sold by
Ballinger Larry Phil and Knox Ballinger Cynthia Jean
Bought by
Ballinger Larry P and Ballinger Cynthia J
Home Financials for this Owner
Home Financials are based on the most recent Mortgage that was taken out on this home.
Original Mortgage
$46,300
Interest Rate
4.12%
Mortgage Type
New Conventional
Purchase Details
Closed on
Jul 17, 2006
Sold by
Knox Gerald L
Bought by
Ballinger Cynthia
Home Financials for this Owner
Home Financials are based on the most recent Mortgage that was taken out on this home.
Original Mortgage
$50,000
Interest Rate
6.73%
Mortgage Type
New Conventional
Purchase Details
Closed on
Oct 4, 2002
Bought by
Ballinger Larry P and Tru Cynthia J K
Purchase Details
Closed on
Aug 7, 2002
Bought by
Ballinger Larry P and Tru Cynthia J K
Create a Home Valuation Report for This Property
The Home Valuation Report is an in-depth analysis detailing your home's value as well as a comparison with similar homes in the area
Home Values in the Area
Average Home Value in this Area
Purchase History
| Date | Buyer | Sale Price | Title Company |
|---|---|---|---|
| Ballinger Larry P & Cynthia J K Trustees | -- | -- | |
| Ballinger Larry P | -- | Nordic Title Agency | |
| Ballinger Cynthia | $50,000 | Marion Title | |
| Ballinger Larry P | -- | -- | |
| Ballinger Larry P | $65,000 | -- | |
| Ballinger Larry P | -- | -- |
Source: Public Records
Mortgage History
| Date | Status | Borrower | Loan Amount |
|---|---|---|---|
| Previous Owner | Ballinger Larry P | $46,300 | |
| Previous Owner | Ballinger Cynthia | $50,000 |
Source: Public Records
Tax History Compared to Growth
Tax History
| Year | Tax Paid | Tax Assessment Tax Assessment Total Assessment is a certain percentage of the fair market value that is determined by local assessors to be the total taxable value of land and additions on the property. | Land | Improvement |
|---|---|---|---|---|
| 2024 | $2,436 | $59,920 | $8,820 | $51,100 |
| 2023 | $2,436 | $59,920 | $8,820 | $51,100 |
| 2022 | $2,492 | $59,920 | $8,820 | $51,100 |
| 2021 | $2,072 | $44,790 | $6,940 | $37,850 |
| 2020 | $2,008 | $44,790 | $6,940 | $37,850 |
| 2019 | $2,003 | $44,790 | $6,940 | $37,850 |
| 2018 | $1,545 | $38,840 | $7,780 | $31,060 |
| 2017 | $1,562 | $38,840 | $7,780 | $31,060 |
| 2016 | $1,561 | $38,840 | $7,780 | $31,060 |
| 2015 | $1,531 | $37,450 | $6,940 | $30,510 |
| 2014 | $1,532 | $37,450 | $6,940 | $30,510 |
| 2012 | $1,659 | $39,270 | $6,390 | $32,880 |
Source: Public Records
Map
Nearby Homes
- 534 Meadow Ln
- 565 Mayfield Dr
- 680 Eton St
- 736 Eton St
- 653 Exeter Way
- 655 Exeter Way
- 1667 Marion Edison Rd
- 0 Richland Rd
- 625 Richland Rd
- 1050 Hathaway Ln
- 1242 Skeawood Dr
- 402 Carolyn Dr
- 386 Pole Lane Rd
- 1575 Kingwood Cir
- 485 New Park Dr
- 499 Carolyn Dr
- 1260 Pineridge Dr
- 1270 Pineridge Dr
- 1070 Chenonceaux Dr
- 1105 Blois Dr
- 1758 Green Way
- 385 Mayfield Dr
- 1777 Summerset Dr
- 1746 Green Way
- 1767 Summerset Dr
- 363 Mayfield Dr
- 420 Meadow Ln
- 1781 Green Way
- 1757 Summerset Dr
- 1734 Green Way
- 386 Mayfield Dr
- 432 Meadow Ln
- 1745 Summerset Dr
- 433 Mayfield Dr
- 427 Meadow Ln
- 1724 Green Way
- 418 Mayfield Dr
- 1816 Green Way
- 1735 Summerset Dr
- 446 Meadow Ln