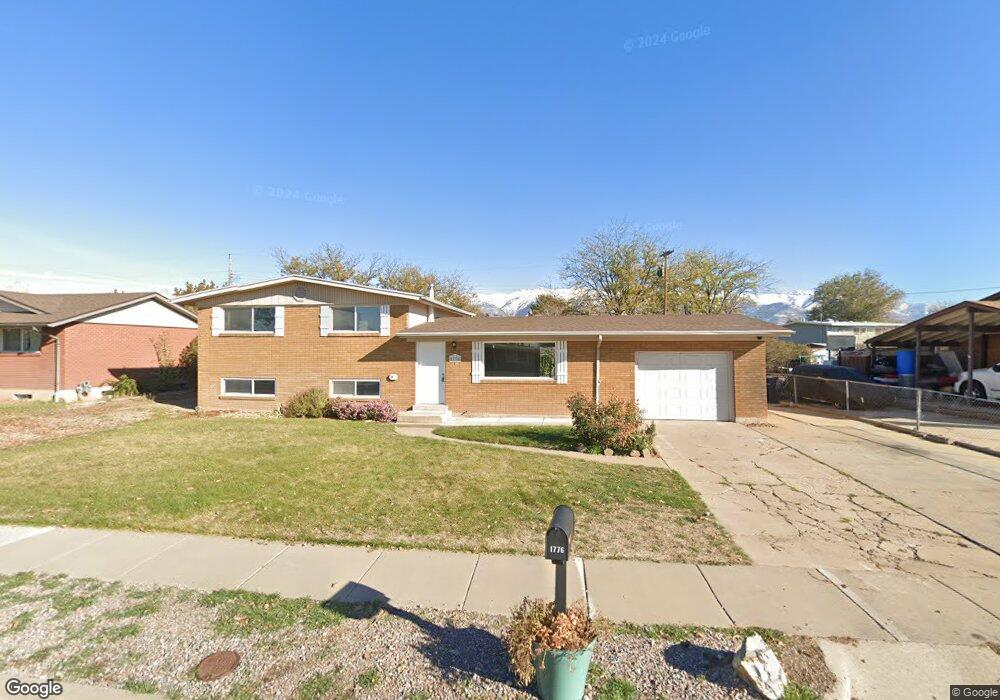
1776 N Celia Way Layton, UT 84041
Estimated Value: $397,000 - $490,000
4
Beds
3
Baths
1,702
Sq Ft
$253/Sq Ft
Est. Value
About This Home
This home is located at 1776 N Celia Way, Layton, UT 84041 and is currently estimated at $431,385, approximately $253 per square foot. 1776 N Celia Way is a home located in Davis County with nearby schools including Vae View Elementary School, Central Davis Junior High School, and Layton High School.
Ownership History
Date
Name
Owned For
Owner Type
Purchase Details
Closed on
Dec 29, 2022
Sold by
Treehouse Investments Llc
Bought by
Young Michael and Young Hannah
Current Estimated Value
Home Financials for this Owner
Home Financials are based on the most recent Mortgage that was taken out on this home.
Original Mortgage
$377,233
Outstanding Balance
$365,189
Interest Rate
6.61%
Mortgage Type
New Conventional
Estimated Equity
$66,196
Purchase Details
Closed on
Oct 3, 2022
Sold by
Buckley Gary W
Bought by
Treehouse Investments Llc
Purchase Details
Closed on
May 18, 2000
Sold by
Buckley Gary and Buckley Sharon
Bought by
Buckley Gary W and Buckley Sharon K
Purchase Details
Closed on
Mar 10, 1998
Sold by
Buckley Gary W and Buckley Sharon Kay
Bought by
Buckley Gary and Buckley Sharon
Purchase Details
Closed on
Feb 18, 1998
Sold by
Buckley Gary and Buckley Sharon
Bought by
Buckley Gary W and Buckley Sharon Kay
Create a Home Valuation Report for This Property
The Home Valuation Report is an in-depth analysis detailing your home's value as well as a comparison with similar homes in the area
Home Values in the Area
Average Home Value in this Area
Purchase History
| Date | Buyer | Sale Price | Title Company |
|---|---|---|---|
| Young Michael | -- | Metro Title | |
| Treehouse Investments Llc | -- | -- | |
| Buckley Gary W | -- | Mountain View Title & Escrow | |
| Buckley Gary | -- | Inwest Title Services Inc | |
| Buckley Gary W | -- | Inwest Title Services Inc |
Source: Public Records
Mortgage History
| Date | Status | Borrower | Loan Amount |
|---|---|---|---|
| Open | Young Michael | $377,233 |
Source: Public Records
Tax History Compared to Growth
Tax History
| Year | Tax Paid | Tax Assessment Tax Assessment Total Assessment is a certain percentage of the fair market value that is determined by local assessors to be the total taxable value of land and additions on the property. | Land | Improvement |
|---|---|---|---|---|
| 2025 | $2,180 | $228,800 | $107,144 | $121,656 |
| 2024 | $2,101 | $222,200 | $127,857 | $94,343 |
| 2023 | $2,028 | $378,000 | $164,370 | $213,630 |
| 2022 | $1,918 | $194,150 | $77,605 | $116,545 |
| 2021 | $444 | $260,000 | $111,159 | $148,841 |
| 2020 | $1,422 | $206,000 | $82,268 | $123,732 |
| 2019 | $1,417 | $201,000 | $79,106 | $121,894 |
| 2018 | $1,229 | $175,000 | $73,247 | $101,753 |
| 2016 | $150 | $79,805 | $20,845 | $58,960 |
| 2015 | $1,043 | $72,710 | $20,845 | $51,865 |
| 2014 | $30 | $72,749 | $20,845 | $51,904 |
| 2013 | -- | $74,388 | $20,680 | $53,708 |
Source: Public Records
Map
Nearby Homes
- 1740 N Gregory Dr
- 1992 W Afton Cir
- 1954 Ann St
- 1916 W Gregory Dr
- 1937 W 1620 N
- 2114 S 825 E
- 1430 N 2100 W
- 1596 N Main St Unit 2
- 1477 N 2375 W
- 1491 N 1875 W
- 1491 N 1875 W Unit 158
- 1487 N 1875 W
- 1487 N 1875 W Unit 159
- 1483 N 1875 W
- 1476 N 1875 W Unit 164
- 1479 N 1875 W
- 1479 N 1875 W Unit 161
- 1463 N 1875 W Unit 165
- 1463 N 1875 W
- 1459 N 1875 W
- 1760 N Celia Way
- 1790 N Celia Way
- 1775 N Mark St
- 1800 N Celia Way
- 2100 Clara St
- 1777 N Celia Way
- 1791 N Mark St
- 2080 Clara St
- 1742 N Celia Way
- 1765 N Celia Way
- 1759 N Celia Way
- 1793 N Celia Way
- 1755 N Celia Way
- 1812 N Celia Way
- 1809 N Mark St
- 1801 N Celia Way
- 914 S 2075 W
- 1752 N Mark St
- 1770 N Mark St
- 1830 N Celia Way