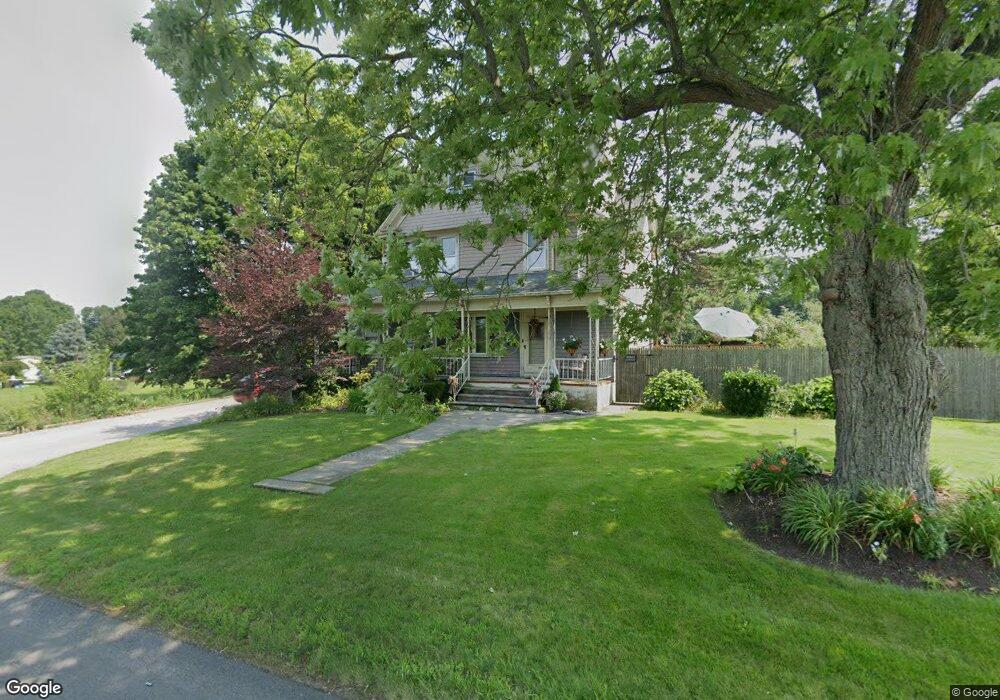
1776 Read St Somerset, MA 02726
Brayton Point NeighborhoodEstimated Value: $582,000 - $625,463
5
Beds
3
Baths
2,487
Sq Ft
$245/Sq Ft
Est. Value
About This Home
This home is located at 1776 Read St, Somerset, MA 02726 and is currently estimated at $609,116, approximately $244 per square foot. 1776 Read St is a home located in Bristol County with nearby schools including South Elementary School, Somerset Middle School, and Swansea Wood School.
Ownership History
Date
Name
Owned For
Owner Type
Purchase Details
Closed on
Oct 31, 2012
Sold by
Borden Brent F
Bought by
Borden Brent F and Borden Johncie M
Current Estimated Value
Home Financials for this Owner
Home Financials are based on the most recent Mortgage that was taken out on this home.
Original Mortgage
$250,000
Outstanding Balance
$41,368
Interest Rate
3.5%
Mortgage Type
New Conventional
Estimated Equity
$567,748
Purchase Details
Closed on
Jul 28, 2005
Sold by
Santagata Jeffrey and Santagata Rebekah
Bought by
Borden Brent F
Purchase Details
Closed on
Aug 8, 2003
Sold by
Paulson Cathleen M and Paulson Charles E
Bought by
Santagata Jeffrey and Santagata Rebekah
Purchase Details
Closed on
Oct 21, 1999
Sold by
Paulson Charles E and Paulson Cathleen M
Bought by
Santagata Jeffrey and Santagata Rebekah
Create a Home Valuation Report for This Property
The Home Valuation Report is an in-depth analysis detailing your home's value as well as a comparison with similar homes in the area
Home Values in the Area
Average Home Value in this Area
Purchase History
| Date | Buyer | Sale Price | Title Company |
|---|---|---|---|
| Borden Brent F | -- | -- | |
| Borden Brent F | -- | -- | |
| Borden Brent F | -- | -- | |
| Borden Brent F | $429,000 | -- | |
| Borden Brent F | $429,000 | -- | |
| Santagata Jeffrey | -- | -- | |
| Santagata Jeffrey | -- | -- | |
| Santagata Jeffrey | $175,000 | -- | |
| Santagata Jeffrey | $175,000 | -- |
Source: Public Records
Mortgage History
| Date | Status | Borrower | Loan Amount |
|---|---|---|---|
| Open | Borden Brent F | $250,000 | |
| Closed | Borden Brent F | $250,000 |
Source: Public Records
Tax History Compared to Growth
Tax History
| Year | Tax Paid | Tax Assessment Tax Assessment Total Assessment is a certain percentage of the fair market value that is determined by local assessors to be the total taxable value of land and additions on the property. | Land | Improvement |
|---|---|---|---|---|
| 2025 | $7,572 | $569,300 | $194,000 | $375,300 |
| 2024 | $6,834 | $534,300 | $194,000 | $340,300 |
| 2023 | $6,306 | $497,300 | $169,300 | $328,000 |
| 2022 | $6,091 | $458,300 | $147,800 | $310,500 |
| 2021 | $6,164 | $419,900 | $134,800 | $285,100 |
| 2020 | $5,787 | $380,200 | $134,800 | $245,400 |
| 2019 | $6,683 | $366,200 | $134,800 | $231,400 |
| 2018 | $5,634 | $332,200 | $134,800 | $197,400 |
| 2017 | $5,425 | $311,800 | $128,800 | $183,000 |
| 2016 | $5,460 | $311,800 | $128,800 | $183,000 |
| 2015 | $5,247 | $302,400 | $126,800 | $175,600 |
| 2014 | $7,356 | $304,600 | $126,800 | $177,800 |
Source: Public Records
Map
Nearby Homes
- 24 Front St
- 30 Front St
- 8 2nd St
- 675 Lees River Ave
- 34 Base Lodge Ln
- 197 Alberta Ave
- 33 Rhinecliffe Rd
- 1 Taunton River
- 19 Richard Rd
- 126 Jaffrey St
- 0 Hortonville Rd Unit 73242268
- 24 Knapp St
- 337 Lepes Rd
- 265 Stevens Rd
- 8 Tower Hill Rd
- 167 Mercier Ave
- 194 Hortonville Rd
- 0 Bark St Unit 1342599
- 0 Bark St Unit 73152576
- 105 Cornhill Rd