Estimated Value: $422,000 - $430,000
4
Beds
2
Baths
1,932
Sq Ft
$221/Sq Ft
Est. Value
About This Home
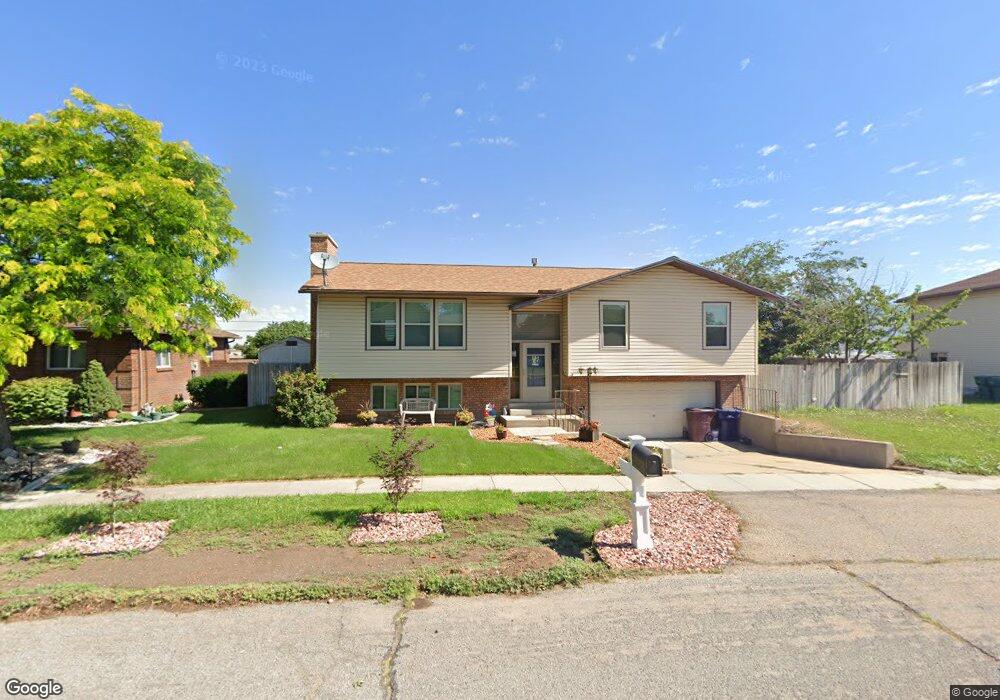
This home is located at 1776 W 4425 S, Roy, UT 84067 and is currently estimated at $426,782, approximately $220 per square foot. 1776 W 4425 S is a home located in Weber County with nearby schools including North Park School, Sand Ridge Junior High School, and Roy High School.
Ownership History
Date
Name
Owned For
Owner Type
Purchase Details
Closed on
Aug 5, 2004
Sold by
Dunn Wallace
Bought by
Dunn Wallace and Dunn Lyndee A
Current Estimated Value
Home Financials for this Owner
Home Financials are based on the most recent Mortgage that was taken out on this home.
Original Mortgage
$117,600
Outstanding Balance
$62,143
Interest Rate
7%
Mortgage Type
New Conventional
Estimated Equity
$364,639
Purchase Details
Closed on
Jul 25, 2003
Sold by
Dunn Wallace
Bought by
Dunn Wallace and Dunn Lyndee A
Purchase Details
Closed on
Aug 15, 1997
Sold by
Pinkston Darlene
Bought by
Peterson Stephen H
Home Financials for this Owner
Home Financials are based on the most recent Mortgage that was taken out on this home.
Original Mortgage
$75,600
Interest Rate
7.61%
Create a Home Valuation Report for This Property
The Home Valuation Report is an in-depth analysis detailing your home's value as well as a comparison with similar homes in the area
Home Values in the Area
Average Home Value in this Area
Purchase History
| Date | Buyer | Sale Price | Title Company |
|---|---|---|---|
| Dunn Wallace | -- | Inwest Title Ogden | |
| Dunn Wallace | -- | Inwest Title Ogden | |
| Dunn Wallace | -- | -- | |
| Peterson Stephen H | -- | U S Title | |
| Pinkston Darlene | -- | U S Title |
Source: Public Records
Mortgage History
| Date | Status | Borrower | Loan Amount |
|---|---|---|---|
| Open | Dunn Wallace | $117,600 | |
| Closed | Peterson Stephen H | $75,600 | |
| Closed | Dunn Wallace | $29,400 |
Source: Public Records
Tax History Compared to Growth
Tax History
| Year | Tax Paid | Tax Assessment Tax Assessment Total Assessment is a certain percentage of the fair market value that is determined by local assessors to be the total taxable value of land and additions on the property. | Land | Improvement |
|---|---|---|---|---|
| 2025 | $2,603 | $412,398 | $149,474 | $262,924 |
| 2024 | $2,544 | $223,299 | $82,218 | $141,081 |
| 2023 | $2,464 | $216,700 | $80,106 | $136,594 |
| 2022 | $2,346 | $211,200 | $64,175 | $147,025 |
| 2021 | $2,022 | $300,000 | $82,560 | $217,440 |
| 2020 | $1,828 | $248,000 | $82,560 | $165,440 |
| 2019 | $1,862 | $239,000 | $47,975 | $191,025 |
| 2018 | $1,729 | $208,000 | $43,122 | $164,878 |
| 2017 | $1,588 | $178,000 | $43,122 | $134,878 |
| 2016 | $1,537 | $92,616 | $23,953 | $68,663 |
| 2015 | $1,402 | $86,101 | $21,285 | $64,816 |
| 2014 | $1,310 | $78,825 | $21,285 | $57,540 |
Source: Public Records
Map
Nearby Homes
- 1825 W 4400 S
- 4438 S 1700 W
- 1681 W 4450 S
- 4501 S 1720 W
- 4502 S 1720 W
- 1825 W 4500 S Unit 101
- 4536 S 1900 W Unit 12
- 1766 W 4575 S
- 4552 S 1675 W
- 4642 S 1900 W Unit 41
- 4593 Promenade Dr
- 4602 Hathaway Dr
- 4475 S 1975 W
- 2015 W 4225 S
- 2082 W 4450 S
- 2038 W 4600 S
- 4220 S 2075 W
- 4205 S 2075 W
- 4328 S 2175 W
- 2067 W 4750 S