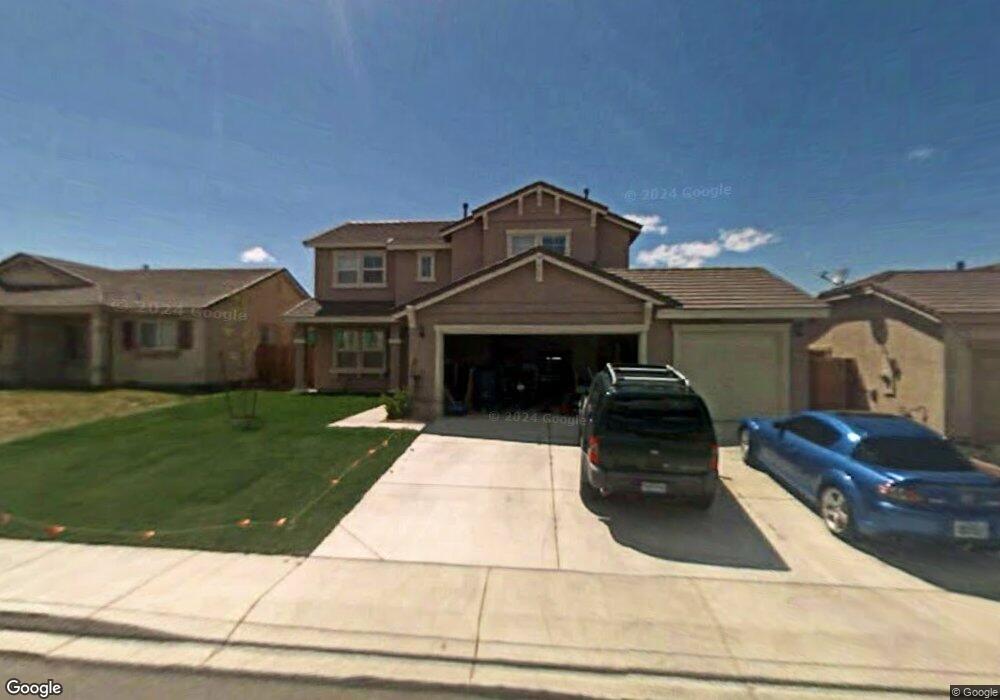
1776 Walnut Dr Fernley, NV 89408
Estimated Value: $461,043 - $486,000
4
Beds
3
Baths
2,472
Sq Ft
$191/Sq Ft
Est. Value
About This Home
This home is located at 1776 Walnut Dr, Fernley, NV 89408 and is currently estimated at $473,261, approximately $191 per square foot. 1776 Walnut Dr is a home located in Lyon County with nearby schools including Fernley Elementary School, Fernley Intermediate School, and Fernley High School.
Ownership History
Date
Name
Owned For
Owner Type
Purchase Details
Closed on
Oct 12, 2017
Sold by
Dittman Robert E and Dittman Tammy L
Bought by
Dittman Robert E and Dittman Tammy L
Current Estimated Value
Purchase Details
Closed on
Dec 5, 2008
Sold by
Federal National Mortgage Association
Bought by
Dittman Robert E and Dittman Tammy L
Home Financials for this Owner
Home Financials are based on the most recent Mortgage that was taken out on this home.
Original Mortgage
$199,900
Outstanding Balance
$134,258
Interest Rate
6.47%
Mortgage Type
VA
Estimated Equity
$339,003
Purchase Details
Closed on
Nov 14, 2007
Sold by
Kent James G
Bought by
Federal National Mortgage Association
Purchase Details
Closed on
Jul 18, 2005
Sold by
Kent Heather A
Bought by
Kent James G
Home Financials for this Owner
Home Financials are based on the most recent Mortgage that was taken out on this home.
Original Mortgage
$260,600
Interest Rate
7.12%
Mortgage Type
Adjustable Rate Mortgage/ARM
Purchase Details
Closed on
Jun 24, 2005
Sold by
R & K Homes Royal Oaks Llc
Bought by
Kent James G
Home Financials for this Owner
Home Financials are based on the most recent Mortgage that was taken out on this home.
Original Mortgage
$260,600
Interest Rate
7.12%
Mortgage Type
Adjustable Rate Mortgage/ARM
Create a Home Valuation Report for This Property
The Home Valuation Report is an in-depth analysis detailing your home's value as well as a comparison with similar homes in the area
Home Values in the Area
Average Home Value in this Area
Purchase History
| Date | Buyer | Sale Price | Title Company |
|---|---|---|---|
| Dittman Robert E | -- | None Available | |
| Dittman Robert E | $199,900 | First American Title Reno | |
| Federal National Mortgage Association | $222,430 | Ticor Title Of Nevada | |
| Kent James G | -- | Title Service & Escrow Co | |
| Kent James G | $274,345 | Title Service & Escrow |
Source: Public Records
Mortgage History
| Date | Status | Borrower | Loan Amount |
|---|---|---|---|
| Open | Dittman Robert E | $199,900 | |
| Previous Owner | Kent James G | $260,600 |
Source: Public Records
Tax History Compared to Growth
Tax History
| Year | Tax Paid | Tax Assessment Tax Assessment Total Assessment is a certain percentage of the fair market value that is determined by local assessors to be the total taxable value of land and additions on the property. | Land | Improvement |
|---|---|---|---|---|
| 2025 | $2,256 | $134,985 | $42,000 | $92,985 |
| 2024 | $2,599 | $136,439 | $42,000 | $94,439 |
| 2023 | $2,599 | $130,032 | $42,000 | $88,032 |
| 2022 | $2,439 | $122,984 | $42,000 | $80,984 |
| 2021 | $2,405 | $106,945 | $28,000 | $78,945 |
| 2020 | $2,191 | $98,442 | $28,000 | $70,442 |
| 2019 | $2,155 | $96,095 | $28,000 | $68,095 |
| 2018 | $2,108 | $90,852 | $24,500 | $66,352 |
| 2017 | $2,092 | $81,377 | $15,050 | $66,327 |
| 2016 | $1,894 | $63,243 | $5,780 | $57,463 |
| 2015 | $1,928 | $48,591 | $5,780 | $42,811 |
| 2014 | $1,883 | $44,980 | $5,780 | $39,200 |
Source: Public Records
Map
Nearby Homes
- 1715 Short Oak Ct
- 610 Desert Shadows Ln
- 1720 Blue Oak Ct
- 234 Red Oak Dr
- 242 Red Oak Dr
- 1453 Grey Bluffs Dr
- 180 Walnut Dr
- 1394 Red Bluff Way Unit 1
- 910 Desert Shadows Ln
- 13 Valley View Dr
- 21 Valley View Dr
- 113-123 Sario Dr
- 785 Garnet Way
- 6405 Highway 95a Unit 247
- 8350 Highway 95a
- 3690 Highway 95a
- 3670 Highway 95a
- 5460 Highway 95a
- 3565 Highway 95a
- 3985 Highway 95a
- 1778 Walnut Dr
- 1774 Walnut Dr Unit 1
- 1780 Walnut Dr
- 1772 Walnut Dr
- 120 Red Oak Ct
- 1773 Walnut Dr
- 1782 Walnut Dr
- 1770 Walnut Dr
- 118 Red Oak Ct
- 1784 Walnut Dr
- 121 Red Oak Ct
- 103 Big Oaks Dr
- 127 Hazelnut Dr
- 125 Hazelnut Dr Unit 1
- 116 Red Oak Ct
- 119 Red Oak Ct
- 129 Hazelnut Dr
- 101 Big Oaks Dr Unit 1
- 1769 Walnut Dr Unit SIERRA MEADOWS SUBDI
- 1769 Walnut Dr