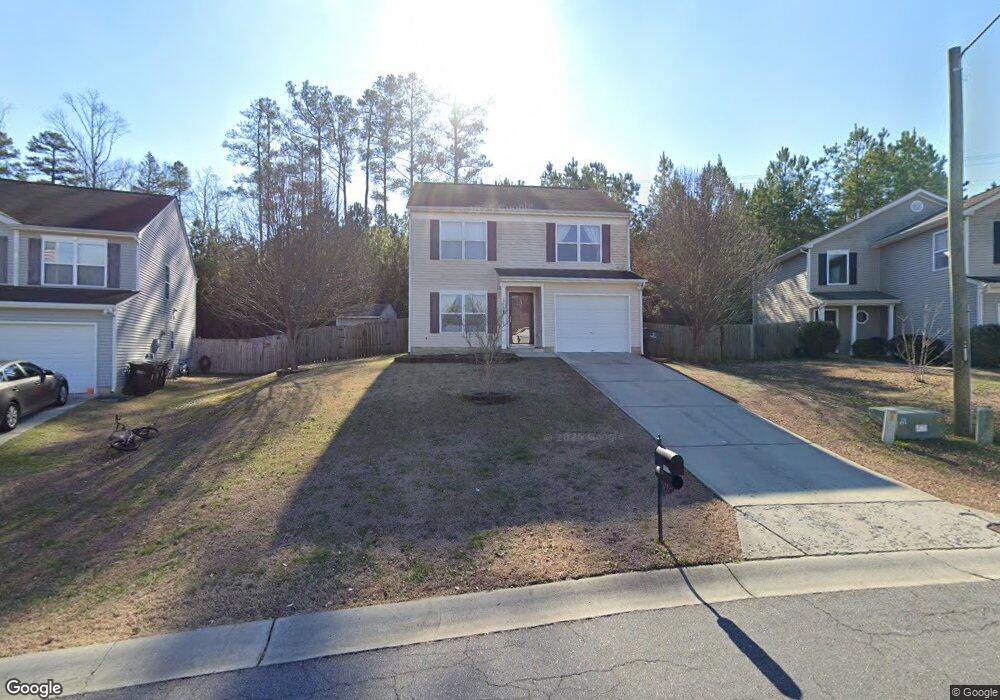
1777 Red Bird Cir SE Concord, NC 28025
Estimated Value: $323,859 - $361,000
3
Beds
3
Baths
1,595
Sq Ft
$214/Sq Ft
Est. Value
About This Home
This home is located at 1777 Red Bird Cir SE, Concord, NC 28025 and is currently estimated at $340,715, approximately $213 per square foot. 1777 Red Bird Cir SE is a home located in Cabarrus County with nearby schools including W.M. Irvin Elementary School, Mount Pleasant Middle School, and Mount Pleasant High School.
Ownership History
Date
Name
Owned For
Owner Type
Purchase Details
Closed on
Oct 6, 2021
Sold by
Germanson Marla
Bought by
Bsfr 1 Owner Llp
Current Estimated Value
Purchase Details
Closed on
Apr 7, 2015
Sold by
Zablocki Harold R and Zablocki Heather
Bought by
Germanson Marla
Purchase Details
Closed on
Apr 10, 2007
Sold by
Davis Michael L
Bought by
Zablocki Harold R and Zablocki Heather
Home Financials for this Owner
Home Financials are based on the most recent Mortgage that was taken out on this home.
Original Mortgage
$132,825
Interest Rate
6.15%
Mortgage Type
Purchase Money Mortgage
Purchase Details
Closed on
Jul 27, 2006
Sold by
Craft Homes Usa Llc
Bought by
Davis Michael
Home Financials for this Owner
Home Financials are based on the most recent Mortgage that was taken out on this home.
Original Mortgage
$101,820
Interest Rate
7.12%
Mortgage Type
Purchase Money Mortgage
Create a Home Valuation Report for This Property
The Home Valuation Report is an in-depth analysis detailing your home's value as well as a comparison with similar homes in the area
Home Values in the Area
Average Home Value in this Area
Purchase History
| Date | Buyer | Sale Price | Title Company |
|---|---|---|---|
| Bsfr 1 Owner Llp | $274,500 | Chicago Title Insurance Co | |
| Germanson Marla | $127,500 | None Available | |
| Zablocki Harold R | $140,000 | None Available | |
| Davis Michael | $127,500 | Realty Title Settlement Svcs |
Source: Public Records
Mortgage History
| Date | Status | Borrower | Loan Amount |
|---|---|---|---|
| Previous Owner | Zablocki Harold R | $132,825 | |
| Previous Owner | Davis Michael | $101,820 |
Source: Public Records
Tax History Compared to Growth
Tax History
| Year | Tax Paid | Tax Assessment Tax Assessment Total Assessment is a certain percentage of the fair market value that is determined by local assessors to be the total taxable value of land and additions on the property. | Land | Improvement |
|---|---|---|---|---|
| 2025 | $2,886 | $289,780 | $65,000 | $224,780 |
| 2024 | $2,886 | $289,780 | $65,000 | $224,780 |
| 2023 | $2,052 | $168,160 | $35,000 | $133,160 |
| 2022 | $2,052 | $168,160 | $35,000 | $133,160 |
| 2021 | $2,052 | $168,160 | $35,000 | $133,160 |
| 2020 | $2,052 | $168,160 | $35,000 | $133,160 |
| 2019 | $1,417 | $116,110 | $15,000 | $101,110 |
| 2018 | $1,393 | $116,110 | $15,000 | $101,110 |
| 2017 | $1,361 | $115,380 | $15,000 | $100,380 |
| 2016 | $808 | $129,380 | $28,000 | $101,380 |
| 2015 | $1,527 | $129,380 | $28,000 | $101,380 |
| 2014 | $1,527 | $129,380 | $28,000 | $101,380 |
Source: Public Records
Map
Nearby Homes
- 1695 Lemming Dr
- 1930 Cold Springs Rd
- 1800 Lake Lynn Rd
- 5200 Fieldstone Dr
- 2365 Baxter Place SE
- 3261 Fairmead Dr
- 2909 Arbor Knoll
- 3109 Fairmead Dr
- 2432 Baxter Place SE
- 2905 Atando Rd
- 2628 State Highway 49
- 1508 Thompson Dr
- 425 Krimminger Ave SE
- 4165 Laurelwood Ct
- 1128 Tangle Ridge Dr SE
- 4430 Laurelwood Ct
- 1223 Walker Rd
- 2406 Everton Cir SE
- 839 Oak Manor Dr SE
- 1160 Tangle Ridge Dr SE
- 1777 Red Bird Cir
- 1781 Red Bird Cir
- 1773 Red Bird Cir
- 1769 Red Bird Cir
- 1785 Red Bird Cir
- 1782 Red Bird Cir
- 1782 Red Bird Cir SE
- 1765 Red Bird Cir
- 1768 Red Bird Cir
- 1789 Red Bird Cir
- 1614 Wild Turkey Ln
- 1761 Red Bird Cir
- 1760 Red Bird Cir
- 1795 Red Bird Cir
- 1622 Wild Turkey Ln
- 1622 Wild Turkey Way SE
- 1753 Red Bird Cir
- 1754 Red Bird Cir
- 1799 Red Bird Cir
- 1753 Red Bird Cir SE