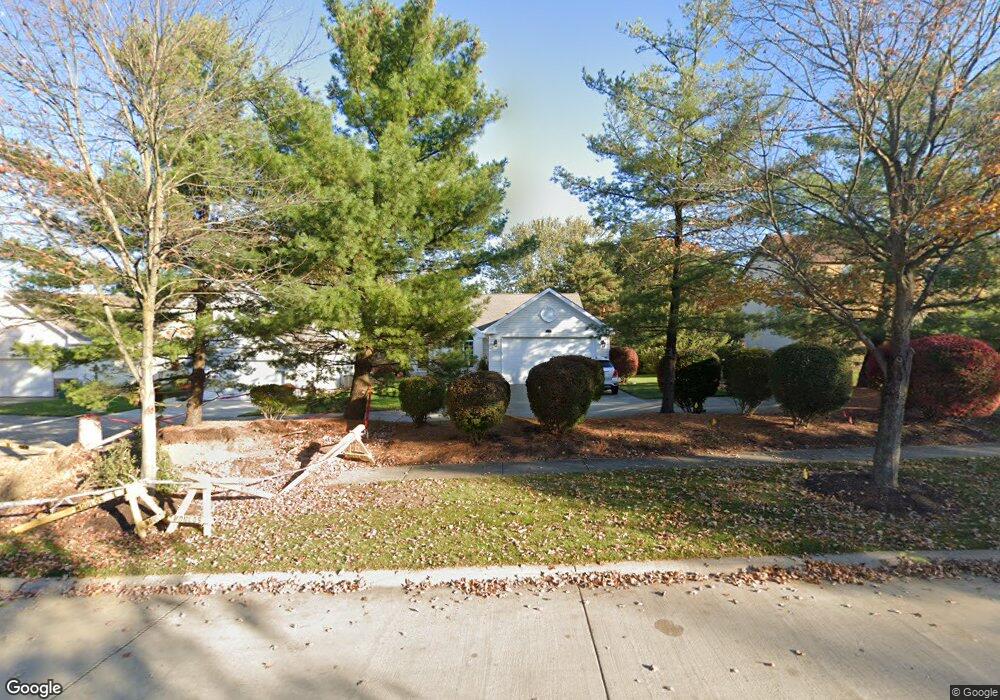
17770 Brandywine Dr Strongsville, OH 44136
Estimated Value: $301,000 - $409,000
2
Beds
2
Baths
1,860
Sq Ft
$189/Sq Ft
Est. Value
About This Home
This home is located at 17770 Brandywine Dr, Strongsville, OH 44136 and is currently estimated at $351,704, approximately $189 per square foot. 17770 Brandywine Dr is a home located in Cuyahoga County with nearby schools including Strongsville High School and Sts Joseph & John Interparochial School.
Ownership History
Date
Name
Owned For
Owner Type
Purchase Details
Closed on
Mar 30, 2016
Sold by
Green David W and Green Diane M
Bought by
Fennell Hollie D
Current Estimated Value
Purchase Details
Closed on
Dec 21, 2015
Sold by
Pinizzotto Jason C and Pinizzotto Kellie L
Bought by
Green David W and Green Diane M
Home Financials for this Owner
Home Financials are based on the most recent Mortgage that was taken out on this home.
Original Mortgage
$65,000
Interest Rate
2.79%
Mortgage Type
Adjustable Rate Mortgage/ARM
Purchase Details
Closed on
Feb 2, 2010
Sold by
Krupla Samuel J and Krupla Linda J
Bought by
Pinizzotto Jason C
Home Financials for this Owner
Home Financials are based on the most recent Mortgage that was taken out on this home.
Original Mortgage
$143,600
Interest Rate
5.09%
Mortgage Type
Purchase Money Mortgage
Purchase Details
Closed on
Mar 25, 1994
Bought by
Krupla Samuel J
Purchase Details
Closed on
Jan 1, 1993
Bought by
Summer Hill Homes Inc
Create a Home Valuation Report for This Property
The Home Valuation Report is an in-depth analysis detailing your home's value as well as a comparison with similar homes in the area
Home Values in the Area
Average Home Value in this Area
Purchase History
| Date | Buyer | Sale Price | Title Company |
|---|---|---|---|
| Fennell Hollie D | -- | Public | |
| Green David W | $192,000 | Gateway Title Agency | |
| Pinizzotto Jason C | $191,300 | New Market Title Llc | |
| Krupla Samuel J | $168,500 | -- | |
| Summer Hill Homes Inc | -- | -- |
Source: Public Records
Mortgage History
| Date | Status | Borrower | Loan Amount |
|---|---|---|---|
| Previous Owner | Green David W | $65,000 | |
| Previous Owner | Pinizzotto Jason C | $143,600 |
Source: Public Records
Tax History Compared to Growth
Tax History
| Year | Tax Paid | Tax Assessment Tax Assessment Total Assessment is a certain percentage of the fair market value that is determined by local assessors to be the total taxable value of land and additions on the property. | Land | Improvement |
|---|---|---|---|---|
| 2024 | $4,416 | $103,845 | $26,775 | $77,070 |
| 2023 | $4,173 | $75,810 | $23,100 | $52,710 |
| 2022 | $4,168 | $75,810 | $23,100 | $52,710 |
| 2021 | $4,136 | $75,810 | $23,100 | $52,710 |
| 2020 | $4,026 | $66,500 | $20,270 | $46,240 |
| 2019 | $3,908 | $190,000 | $57,900 | $132,100 |
| 2018 | $3,547 | $66,500 | $20,270 | $46,240 |
| 2017 | $4,263 | $64,260 | $16,590 | $47,670 |
| 2016 | $3,653 | $64,260 | $16,590 | $47,670 |
| 2015 | $4,185 | $64,260 | $16,590 | $47,670 |
| 2014 | $4,288 | $64,260 | $16,590 | $47,670 |
Source: Public Records
Map
Nearby Homes
- 17682 Drake Rd
- 17024 Bear Creek Ln
- 18294 Drake Rd
- 17934 Cambridge Oval
- 17159 Turkey Meadow Ln
- 18411 Yorktown Oval
- 16486 S Red Rock Dr
- 16650 Lanier Ave
- 17069 Partridge Dr
- 18162 Fawn Cir
- 17259 Woodshire Dr
- 18848 Pearl Rd
- 17130 Golden Star Dr
- 19297 Lauren Way
- 16711 Beech Cir
- 19311 Bradford Ct
- 18229 Howe Rd
- 16450 Howe Rd
- 20393 Wildwood Ln
- 18630 Shurmer Rd
- 17782 Brandywine Dr
- 17758 Brandywine Dr
- 17794 Brandywine Dr
- 17734 Brandywine Dr
- 17806 Brandywine Dr
- 17893 Drake Rd
- 17869 High Point Club Blvd
- 17781 Drake Rd
- 17847 High Point Club Blvd
- 17745 Brandywine Dr
- 17710 Brandywine Dr
- 17901 Drake Rd
- 17818 Brandywine Dr
- 17753 Drake Rd
- 17913 Drake Rd
- 17825 High Point Club Blvd
- 17723 Brandywine Dr
- 17739 Drake Rd
- 17803 High Point Club Blvd
- 17682 Brandywine Dr