Estimated Value: $201,000 - $263,000
3
Beds
2
Baths
1,305
Sq Ft
$173/Sq Ft
Est. Value
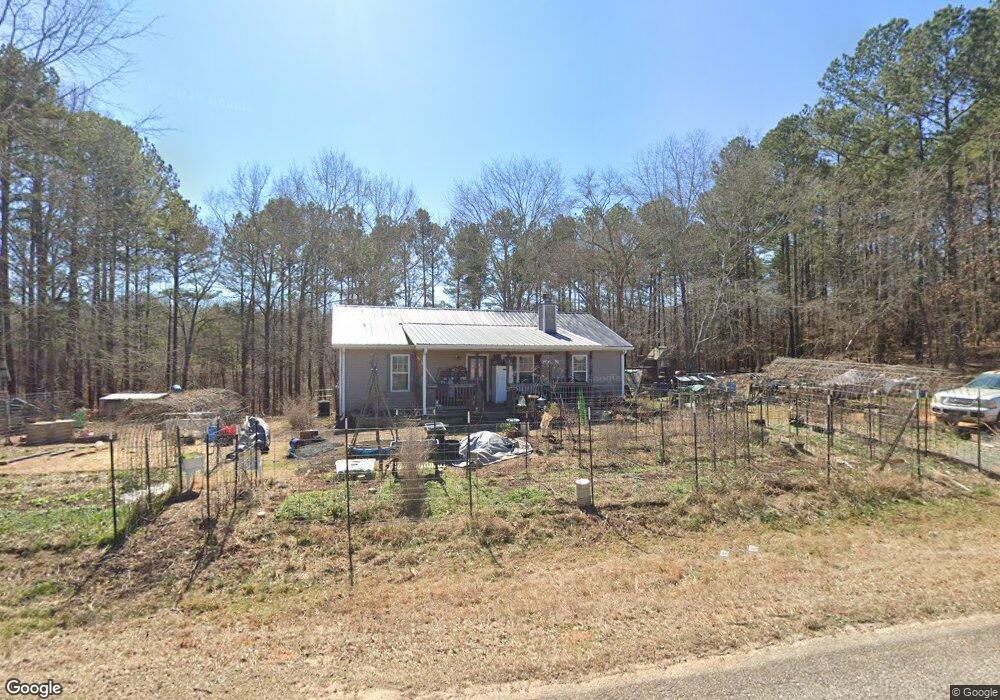
About This Home
This home is located at 1778 Della Slaton Rd, Comer, GA 30629 and is currently estimated at $225,344, approximately $172 per square foot. 1778 Della Slaton Rd is a home located in Madison County with nearby schools including Madison County High School.
Ownership History
Date
Name
Owned For
Owner Type
Purchase Details
Closed on
Oct 27, 2008
Sold by
Accredited Home Lenders In
Bought by
Lasalle Bank National Associat
Current Estimated Value
Purchase Details
Closed on
Feb 5, 2008
Sold by
Teet Lloyd
Bought by
Lasalle Bank
Purchase Details
Closed on
Mar 6, 2007
Sold by
Smith Regina M
Bought by
Teet Lloyd
Home Financials for this Owner
Home Financials are based on the most recent Mortgage that was taken out on this home.
Original Mortgage
$83,120
Interest Rate
9.4%
Mortgage Type
New Conventional
Purchase Details
Closed on
Jun 29, 2001
Sold by
Guest Betty J
Bought by
Smith Regina M
Purchase Details
Closed on
Sep 18, 2000
Sold by
Parham Larry Wayne
Bought by
Guest Betty J
Purchase Details
Closed on
Jan 1, 1992
Bought by
Parham Larry Wayne
Create a Home Valuation Report for This Property
The Home Valuation Report is an in-depth analysis detailing your home's value as well as a comparison with similar homes in the area
Purchase History
| Date | Buyer | Sale Price | Title Company |
|---|---|---|---|
| Lasalle Bank National Associat | $68,500 | -- | |
| Lasalle Bank | $88,627 | -- | |
| Teet Lloyd | $103,900 | -- | |
| Smith Regina M | $92,900 | -- | |
| Guest Betty J | $5,000 | -- | |
| Parham Larry Wayne | $1,200 | -- |
Source: Public Records
Mortgage History
| Date | Status | Borrower | Loan Amount |
|---|---|---|---|
| Previous Owner | Teet Lloyd | $83,120 | |
| Previous Owner | Teet Lloyd | $20,780 |
Source: Public Records
Tax History
| Year | Tax Paid | Tax Assessment Tax Assessment Total Assessment is a certain percentage of the fair market value that is determined by local assessors to be the total taxable value of land and additions on the property. | Land | Improvement |
|---|---|---|---|---|
| 2025 | $1,743 | $70,606 | $8,051 | $62,555 |
| 2024 | $1,733 | $68,573 | $8,051 | $60,522 |
| 2023 | $1,929 | $63,196 | $6,709 | $56,487 |
| 2022 | $1,441 | $54,231 | $4,612 | $49,619 |
| 2021 | $1,223 | $42,058 | $4,612 | $37,446 |
| 2020 | $1,211 | $41,388 | $3,942 | $37,446 |
| 2019 | $1,199 | $40,566 | $3,942 | $36,624 |
| 2018 | $1,154 | $38,998 | $3,606 | $35,392 |
| 2017 | $1,128 | $39,190 | $3,354 | $35,836 |
| 2016 | $894 | $33,129 | $2,994 | $30,134 |
| 2015 | $894 | $33,129 | $2,994 | $30,134 |
| 2014 | $901 | $33,196 | $2,649 | $30,547 |
| 2013 | -- | $33,196 | $2,649 | $30,547 |
Source: Public Records
Map
Nearby Homes
- 1271 Della Slaton Rd
- 1257 Seymour Rd
- 2285 Cherokee Rd
- 0 Sand Hill Rd Unit 10595328
- 3272 Horace Rd
- 0 Osley Mill Rd Unit 10671196
- 0 Osley Mill Rd Unit CL346762
- 0 Paoli Rd Unit 23882833
- 2115 Dusty Rd
- 0 River Rd Unit 10639917
- 8714 Georgia 172
- 1574 Cordell Rd
- 0 Dusty Rd Unit 10569563
- 0 Dusty Rd Unit 7619983
- 2607 Hughes Rd
- 00 River Rd
- 2660 Parham Town Rd
- 494 S Broad St
- 2975 Georgia 72
- 2448 Allen White Rd
- 2070 Della Slaton Rd
- 1692 Della Slaton Rd
- 1782 Della Slaton Rd
- 1694 Della Slaton Rd
- 119 Bells Ferry Rd
- 2078 Della Slaton Rd
- 315 Bells Ferry Rd
- 93 Jones Dr
- 2025 Della Slaton Rd
- 446 Bells Ferry Rd
- 1782 Jones Dr
- 1412 Della Slaton Rd
- 2195 Della Slaton Rd
- 15 Deer Track Rd
- 2246 Della Slaton Rd
- 486 Bells Ferry Rd
- 1432 Della Slaton Rd
- 540 Bells Ferry Rd
- 2307 Della Slaton Rd
- 1227 Della Slaton Rd
Your Personal Tour Guide
Ask me questions while you tour the home.