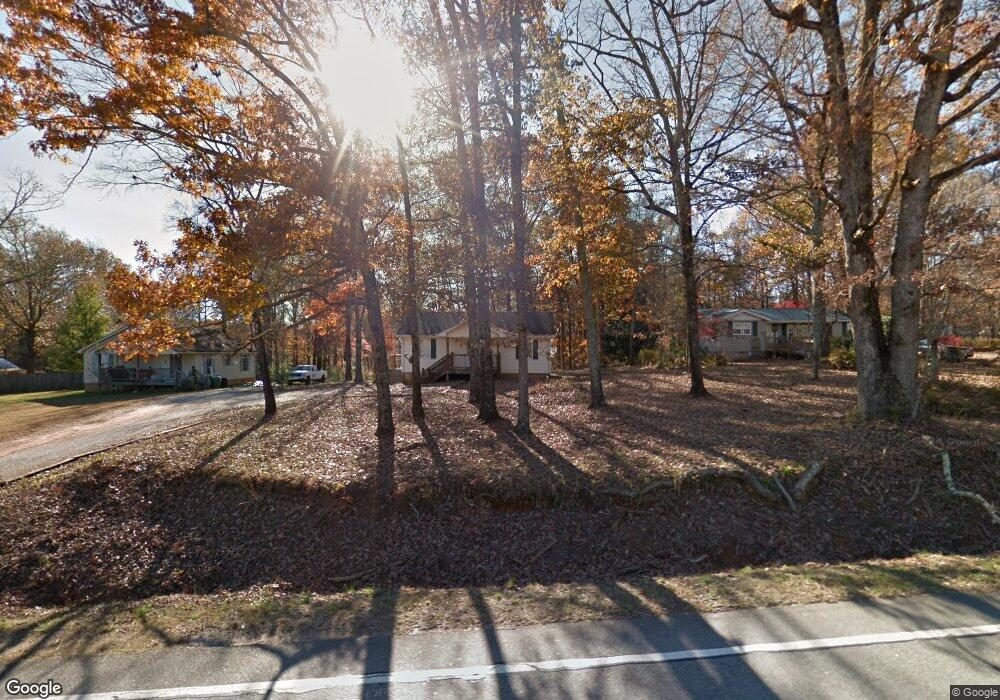
1778 Georgia 17 Clarkesville, GA 30523
Estimated Value: $181,000 - $257,000
2
Beds
1
Bath
864
Sq Ft
$236/Sq Ft
Est. Value
About This Home
This home is located at 1778 Georgia 17, Clarkesville, GA 30523 and is currently estimated at $203,813, approximately $235 per square foot. 1778 Georgia 17 is a home located in Habersham County with nearby schools including Fairview Elementary School, North Habersham Middle School, and Habersham Success Academy.
Ownership History
Date
Name
Owned For
Owner Type
Purchase Details
Closed on
Oct 4, 2018
Sold by
Wingate Llc
Bought by
Brock Joshua K
Current Estimated Value
Purchase Details
Closed on
Mar 18, 2014
Sold by
Hill Michael Shad
Bought by
Wingate Llc
Purchase Details
Closed on
Nov 5, 2013
Sold by
Anderson Richard N
Bought by
Bank Of America
Purchase Details
Closed on
Apr 1, 2008
Sold by
Not Provided
Bought by
Anderson Richard N
Home Financials for this Owner
Home Financials are based on the most recent Mortgage that was taken out on this home.
Original Mortgage
$88,609
Interest Rate
6.03%
Mortgage Type
FHA
Purchase Details
Closed on
Jun 1, 2007
Sold by
Not Provided
Bought by
Anderson Richard N
Home Financials for this Owner
Home Financials are based on the most recent Mortgage that was taken out on this home.
Original Mortgage
$111,410
Interest Rate
6.12%
Mortgage Type
New Conventional
Create a Home Valuation Report for This Property
The Home Valuation Report is an in-depth analysis detailing your home's value as well as a comparison with similar homes in the area
Home Values in the Area
Average Home Value in this Area
Purchase History
| Date | Buyer | Sale Price | Title Company |
|---|---|---|---|
| Brock Joshua K | $75,000 | -- | |
| Wingate Llc | -- | -- | |
| Bank Of America | -- | -- | |
| Anderson Richard N | $90,000 | -- | |
| Anderson Richard N | -- | -- |
Source: Public Records
Mortgage History
| Date | Status | Borrower | Loan Amount |
|---|---|---|---|
| Previous Owner | Anderson Richard N | $88,609 | |
| Previous Owner | Anderson Richard N | $111,410 |
Source: Public Records
Tax History Compared to Growth
Tax History
| Year | Tax Paid | Tax Assessment Tax Assessment Total Assessment is a certain percentage of the fair market value that is determined by local assessors to be the total taxable value of land and additions on the property. | Land | Improvement |
|---|---|---|---|---|
| 2025 | $998 | $61,995 | $9,778 | $52,217 |
| 2024 | -- | $50,220 | $7,564 | $42,656 |
| 2023 | $393 | $42,784 | $7,564 | $35,220 |
| 2022 | $764 | $35,432 | $5,260 | $30,172 |
| 2021 | $729 | $32,472 | $5,260 | $27,212 |
| 2020 | $687 | $27,620 | $4,276 | $23,344 |
| 2019 | $688 | $27,620 | $4,276 | $23,344 |
| 2018 | $714 | $26,724 | $4,276 | $22,448 |
| 2017 | $637 | $23,728 | $3,288 | $20,440 |
| 2016 | $619 | $59,320 | $3,288 | $20,440 |
| 2015 | -- | $59,320 | $3,288 | $20,440 |
| 2014 | $674 | $64,150 | $3,288 | $22,372 |
| 2013 | -- | $25,660 | $3,288 | $22,372 |
Source: Public Records
Map
Nearby Homes
- 147 Crest Winds Dr
- 355 Zeb Bryson Rd
- 350 Kitty Hawk Ln
- 111 On Golden Pond Ln
- 385 Amys Rd
- 123 Grand Oaks Dr
- 271 Panacea Ln
- 4855 Georgia 115
- 0 Highway 115 Unit 10643669
- 4822 Georgia 115
- 715 Ridge Rd
- 180 Harvest Church Rd
- 0 Harvest Church Rd
- 0 Harvest Church Rd Unit LOT 2 10606590
- 0 Harvest Church Rd Unit LOT 1 10606522
- 255 Cool Springs Road Lot Rd Unit 7
- 255 Cool Springs Road -Lot #7 Rd
- 1935 Sam Bell Rd
- 3039 Georgia 17
- 3077 Alec Mountain Rd
- 1788 Highway 17
- 1774 Highway 17
- 1832 Highway 17
- 195 Rising Sun Ln
- 173 Rising Sun Ln
- 150 Rising Sun Ln
- 1703 Highway 17
- 1866 Highway 17
- 205 Rising Sun Ln
- 114 Wounded Knee Trail
- 1865 Highway 17
- 105 Wounded Knee Trail
- 1865 Highway 17
- 129 Wounded Knee Trail
- 0 Rising Sun Unit 8825746
- 0 Rising Sun
- 120 Wounded Knee Trail
- 1663 Highway 17
- 1664 Highway 17
- 130 Wounded Knee Trail