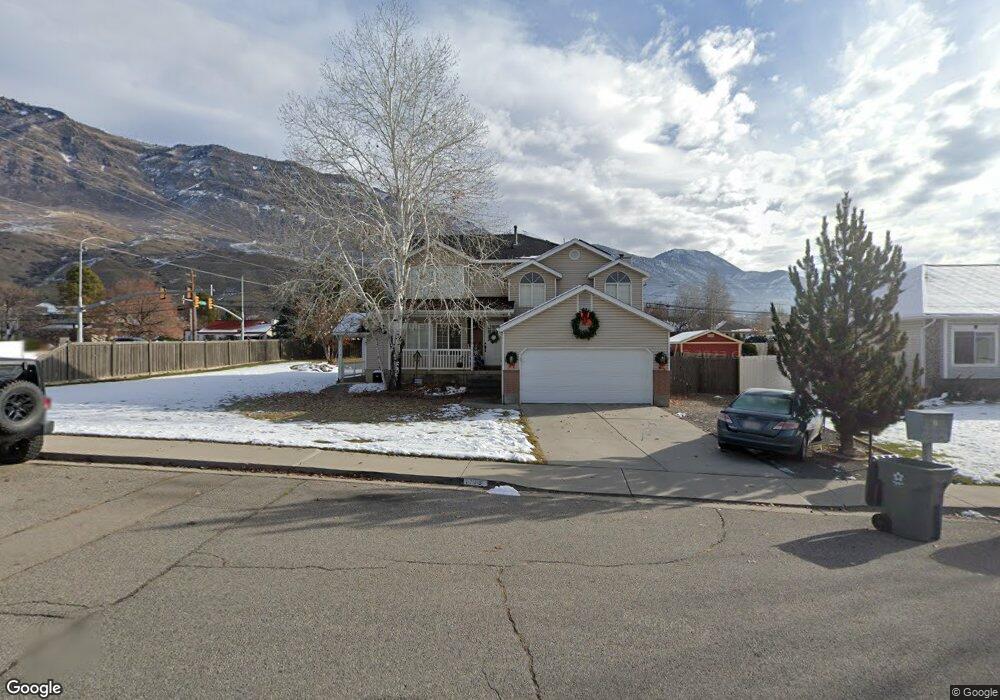
1778 N 70 E Pleasant Grove, UT 84062
Estimated Value: $646,000 - $1,074,000
4
Beds
4
Baths
2,624
Sq Ft
$301/Sq Ft
Est. Value
About This Home
This home is located at 1778 N 70 E, Pleasant Grove, UT 84062 and is currently estimated at $789,683, approximately $300 per square foot. 1778 N 70 E is a home located in Utah County with nearby schools including Manila Elementary School, Pleasant Grove Junior High School, and Pleasant Grove High School.
Ownership History
Date
Name
Owned For
Owner Type
Purchase Details
Closed on
Sep 28, 2021
Sold by
Carr Chad C and Carr Alison M
Bought by
Pleasant Grove City Corporation
Current Estimated Value
Purchase Details
Closed on
May 7, 2021
Sold by
Olson Stephen and Olson Michelle
Bought by
Olson Stephen and Olson Michelle
Create a Home Valuation Report for This Property
The Home Valuation Report is an in-depth analysis detailing your home's value as well as a comparison with similar homes in the area
Home Values in the Area
Average Home Value in this Area
Purchase History
| Date | Buyer | Sale Price | Title Company |
|---|---|---|---|
| Pleasant Grove City Corporation | -- | None Available | |
| Olson Stephen | -- | First American Title Ins Co |
Source: Public Records
Tax History Compared to Growth
Tax History
| Year | Tax Paid | Tax Assessment Tax Assessment Total Assessment is a certain percentage of the fair market value that is determined by local assessors to be the total taxable value of land and additions on the property. | Land | Improvement |
|---|---|---|---|---|
| 2025 | $3,008 | $374,385 | $260,100 | $420,600 |
| 2024 | $3,008 | $359,205 | $0 | $0 |
| 2023 | $3,018 | $368,775 | $0 | $0 |
| 2022 | $2,947 | $358,270 | $0 | $0 |
| 2021 | $2,555 | $472,900 | $163,300 | $309,600 |
| 2020 | $1,984 | $360,000 | $145,800 | $214,200 |
| 2019 | $1,803 | $338,300 | $138,100 | $200,200 |
| 2018 | $1,716 | $304,500 | $130,400 | $174,100 |
| 2017 | $1,684 | $159,060 | $0 | $0 |
| 2016 | $1,606 | $146,465 | $0 | $0 |
| 2015 | $1,535 | $132,605 | $0 | $0 |
| 2014 | $1,469 | $125,675 | $0 | $0 |
Source: Public Records
Map
Nearby Homes
- 1726 N Siena Cir Unit 10
- 1727 N Siena Cir Unit 4
- 1656 N Siena Cir Unit 7
- 429 E 1600 N
- 532 W 2000 N
- 1152 N 200 W
- 1051 N 600 W
- 1031 N 600 W
- 1041 N 600 W
- 731 W 1590 N Unit 15
- 1534 N 750 W Unit 16
- 674 W 1590 N Unit 11
- Konlee Plan at Makin Dreams
- Alexa Plan at Makin Dreams
- Callahan Plan at Makin Dreams
- Hailey Plan at Makin Dreams
- Alydia Plan at Makin Dreams
- Addison Plan at Makin Dreams
- Julia Plan at Makin Dreams
- 1531 N 750 W Unit 4