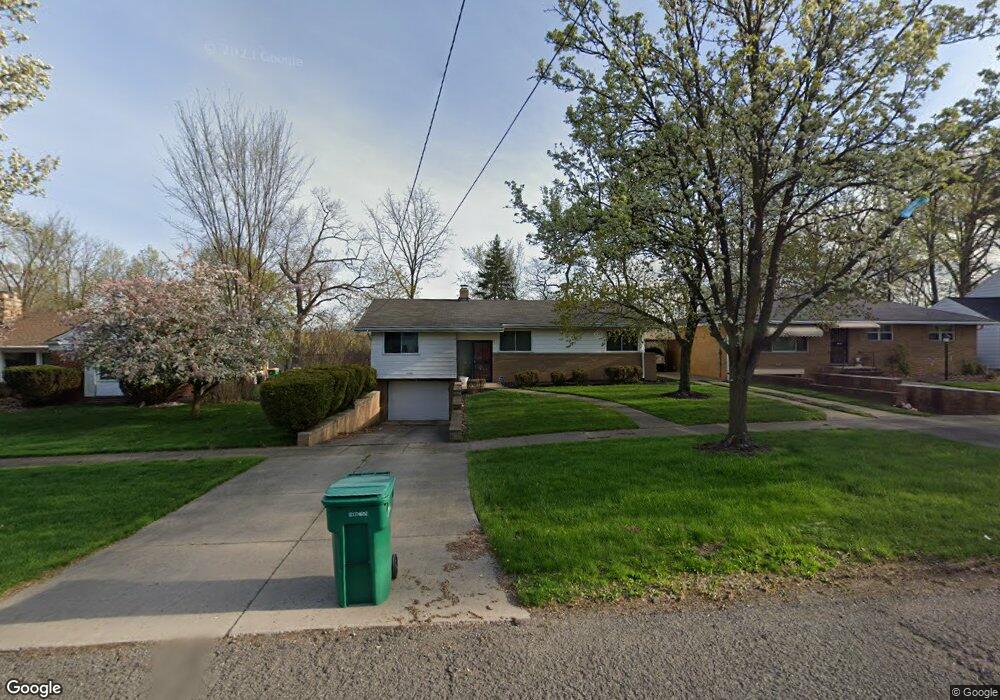
17781 Mccracken Rd Maple Heights, OH 44137
Estimated Value: $131,000 - $153,000
3
Beds
2
Baths
1,132
Sq Ft
$124/Sq Ft
Est. Value
About This Home
This home is located at 17781 Mccracken Rd, Maple Heights, OH 44137 and is currently estimated at $139,881, approximately $123 per square foot. 17781 Mccracken Rd is a home located in Cuyahoga County with nearby schools including Abraham Lincoln Elementary School, Rockside/ J.F. Kennedy School, and Barack Obama School.
Ownership History
Date
Name
Owned For
Owner Type
Purchase Details
Closed on
Feb 13, 2019
Sold by
Estate Of Evelyn M Gordon
Bought by
Gordon Darrick L
Current Estimated Value
Purchase Details
Closed on
Aug 29, 1996
Sold by
Bahrijczuk Peter P
Bought by
Gordon Evelyn M
Home Financials for this Owner
Home Financials are based on the most recent Mortgage that was taken out on this home.
Original Mortgage
$80,370
Interest Rate
8.3%
Mortgage Type
New Conventional
Purchase Details
Closed on
Aug 9, 1984
Sold by
Pete P Bahrijczuk
Bought by
Bahrijczuk Pete P
Purchase Details
Closed on
Jan 17, 1980
Sold by
Bahrijczuk Pete P
Bought by
Pete P Bahrijczuk
Purchase Details
Closed on
Nov 19, 1975
Sold by
Podwaski Roger A and Podwaski Rosemarie
Bought by
Bahrijczuk Pete P
Purchase Details
Closed on
Jan 1, 1975
Bought by
Podwaski Roger A and Podwaski Rosemarie
Create a Home Valuation Report for This Property
The Home Valuation Report is an in-depth analysis detailing your home's value as well as a comparison with similar homes in the area
Home Values in the Area
Average Home Value in this Area
Purchase History
| Date | Buyer | Sale Price | Title Company |
|---|---|---|---|
| Gordon Darrick L | -- | None Available | |
| Gordon Evelyn M | $84,600 | -- | |
| Bahrijczuk Pete P | -- | -- | |
| Pete P Bahrijczuk | -- | -- | |
| Bahrijczuk Pete P | $36,000 | -- | |
| Podwaski Roger A | -- | -- |
Source: Public Records
Mortgage History
| Date | Status | Borrower | Loan Amount |
|---|---|---|---|
| Previous Owner | Gordon Evelyn M | $80,370 |
Source: Public Records
Tax History
| Year | Tax Paid | Tax Assessment Tax Assessment Total Assessment is a certain percentage of the fair market value that is determined by local assessors to be the total taxable value of land and additions on the property. | Land | Improvement |
|---|---|---|---|---|
| 2024 | $3,585 | $39,795 | $8,750 | $31,045 |
| 2023 | $2,138 | $19,220 | $5,040 | $14,180 |
| 2022 | $2,131 | $19,215 | $5,040 | $14,175 |
| 2021 | $2,266 | $19,220 | $5,040 | $14,180 |
| 2020 | $1,949 | $14,560 | $3,820 | $10,750 |
| 2019 | $1,821 | $41,600 | $10,900 | $30,700 |
| 2018 | $1,349 | $14,560 | $3,820 | $10,750 |
| 2017 | $1,808 | $13,170 | $3,540 | $9,630 |
| 2016 | $1,633 | $13,170 | $3,540 | $9,630 |
| 2015 | $1,734 | $13,170 | $3,540 | $9,630 |
| 2014 | $1,734 | $14,460 | $3,890 | $10,570 |
Source: Public Records
Map
Nearby Homes
- 5031 Cato St
- 17282 Mccracken Rd
- 5082 Philip Ave
- 5100 Erwin St
- 5150 Arch St
- 5177 Cato St
- 18704 Longview Ave
- 4821 E 173rd St
- 5219 Joseph St
- 18851 Raymond St
- 5231 Philip Ave
- 5239 Arch St
- 4744 E 176th St
- 4761 E 173rd St
- 5246 Philip Ave
- 16706 Myrtle Ave
- 18990 Raymond St
- 5204 Anthony St
- 5212 Catherine St
- 17806 Tarkington Ave
- 17741 Mccracken Rd
- 17901 Mccracken Rd
- 17905 Mccracken Rd
- 17721 Mccracken Rd
- 17909 Mccracken Rd
- 17711 Mccracken Rd
- 17913 Mccracken Rd
- 17766 Mccracken Rd
- 17762 Mccracken Rd
- 17900 Mccracken Rd
- 17750 Mccracken Rd
- 17904 Mccracken Rd
- 17740 Mccracken Rd
- 17701 Mccracken Rd
- 17917 Mccracken Rd
- 17908 Mccracken Rd
- 17720 Mccracken Rd
- 5032 Cato St
- 17914 Mccracken Rd
- 17523 Mccracken Rd
Your Personal Tour Guide
Ask me questions while you tour the home.