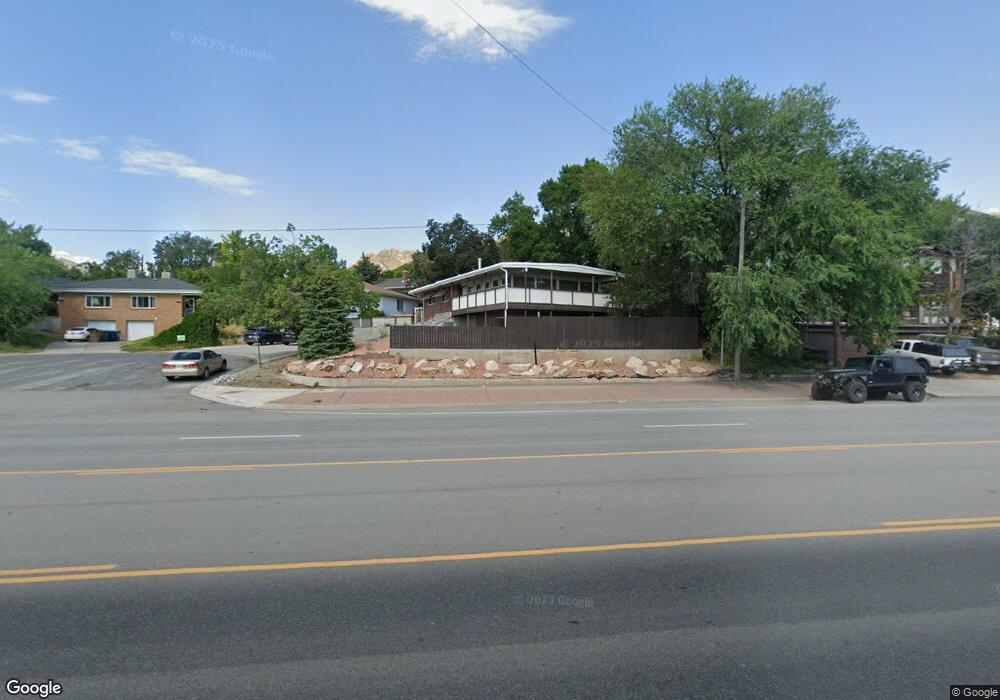
1779 Foothill Dr Salt Lake City, UT 84108
East Bench NeighborhoodEstimated Value: $662,000 - $803,000
4
Beds
2
Baths
1,250
Sq Ft
$581/Sq Ft
Est. Value
About This Home
This home is located at 1779 Foothill Dr, Salt Lake City, UT 84108 and is currently estimated at $726,747, approximately $581 per square foot. 1779 Foothill Dr is a home located in Salt Lake County with nearby schools including Indian Hills Elementary School, Hillside Middle School, and Highland High School.
Ownership History
Date
Name
Owned For
Owner Type
Purchase Details
Closed on
Nov 14, 2018
Sold by
Blankevoort John and Blankevoort Ingrid
Bought by
Blankevoort John E and Blankevoort Ingrid B
Current Estimated Value
Purchase Details
Closed on
May 11, 2011
Sold by
Jones Sherry and Jones Brady
Bought by
Blankevoort John and Blankevoort Ingrid B
Home Financials for this Owner
Home Financials are based on the most recent Mortgage that was taken out on this home.
Original Mortgage
$189,750
Outstanding Balance
$131,624
Interest Rate
4.84%
Mortgage Type
New Conventional
Estimated Equity
$595,123
Purchase Details
Closed on
Mar 11, 2002
Sold by
Boerstra Scott and Boerstra Christina
Bought by
Jones Brady and Jones Sherry
Home Financials for this Owner
Home Financials are based on the most recent Mortgage that was taken out on this home.
Original Mortgage
$153,000
Interest Rate
6.99%
Create a Home Valuation Report for This Property
The Home Valuation Report is an in-depth analysis detailing your home's value as well as a comparison with similar homes in the area
Home Values in the Area
Average Home Value in this Area
Purchase History
| Date | Buyer | Sale Price | Title Company |
|---|---|---|---|
| Blankevoort John E | -- | Accommodation | |
| Blankevoort John | -- | Backman Title Services | |
| Jones Brady | -- | Backman Stewart Title Servic |
Source: Public Records
Mortgage History
| Date | Status | Borrower | Loan Amount |
|---|---|---|---|
| Open | Blankevoort John | $189,750 | |
| Previous Owner | Jones Brady | $153,000 |
Source: Public Records
Tax History Compared to Growth
Tax History
| Year | Tax Paid | Tax Assessment Tax Assessment Total Assessment is a certain percentage of the fair market value that is determined by local assessors to be the total taxable value of land and additions on the property. | Land | Improvement |
|---|---|---|---|---|
| 2025 | $3,113 | $638,500 | $258,000 | $380,500 |
| 2024 | $3,113 | $593,900 | $246,200 | $347,700 |
| 2023 | $3,023 | $555,900 | $236,800 | $319,100 |
| 2022 | $3,308 | $570,800 | $232,100 | $338,700 |
| 2021 | $2,900 | $453,100 | $188,900 | $264,200 |
| 2020 | $2,939 | $437,100 | $176,500 | $260,600 |
| 2019 | $2,287 | $319,900 | $169,000 | $150,900 |
| 2018 | $2,125 | $289,500 | $169,000 | $120,500 |
| 2017 | $2,229 | $284,500 | $169,000 | $115,500 |
| 2016 | $2,192 | $265,700 | $169,000 | $96,700 |
| 2015 | $2,042 | $234,600 | $165,600 | $69,000 |
| 2014 | $1,973 | $224,900 | $165,600 | $59,300 |
Source: Public Records
Map
Nearby Homes
- 1769 S Foothill Dr
- 1802 S Wasatch Dr
- 1825 S 2600 E
- 1881 Foothill Dr
- 1876 S 2600 E
- 1908 S 2600 E
- 2662 E Comanche Dr
- 1940 S 2500 E
- 2618 E Skyline Dr
- 1800 S Devonshire Dr Unit 8
- 1974 Laurelhurst Dr E
- 2326 E 1700 S
- 2366 Logan Ave S
- 1502 S 2400 E
- 2119 King St
- 2109 S Texas St
- 2005 Scenic Dr E
- 2505 E Elm Ave
- 2777 E Comanche Dr
- 2225 Ramona Ave
- 1779 S Foothill Dr Unit A
- 1779 S Foothill Dr
- 1787 Foothill Dr
- 1769 Foothill Dr
- 1772 Laurelhurst Dr E
- 1772 Laurelhurst Dr
- 1780 Laurelhurst Dr
- 1786 S Laurelhurst Dr
- 1763 Foothill Dr Unit 1765
- 1766 Laurelhurst Dr
- 1786 Laurelhurst Dr
- 1797 Foothill Dr
- 1757 Foothill Dr
- 1788 Foothill Dr Unit 1790
- 1758 Laurelhurst Dr
- 1758 S Laurelhurst Dr
- 1790 S Foothill Dr Unit 1790
- 1792 S Laurelhurst Dr
- 1788 S Foothill Dr
- 1792 Laurelhurst Dr