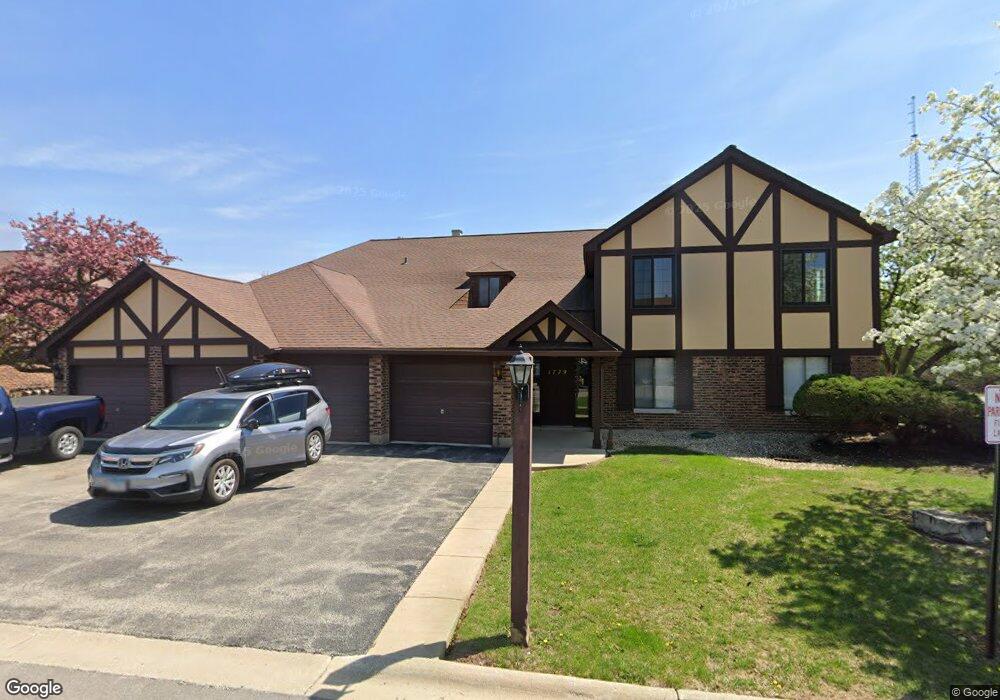
1779 Gloucester Ct Unit D Wheaton, IL 60189
North Danada NeighborhoodEstimated Value: $244,756 - $283,000
2
Beds
1
Bath
1,056
Sq Ft
$254/Sq Ft
Est. Value
About This Home
This home is located at 1779 Gloucester Ct Unit D, Wheaton, IL 60189 and is currently estimated at $268,439, approximately $254 per square foot. 1779 Gloucester Ct Unit D is a home located in DuPage County with nearby schools including Briar Glen Elementary School, Glen Crest Middle School, and Glenbard South High School.
Ownership History
Date
Name
Owned For
Owner Type
Purchase Details
Closed on
Jun 30, 2005
Sold by
Minor R Marlene
Bought by
Burk Rhonda G
Current Estimated Value
Home Financials for this Owner
Home Financials are based on the most recent Mortgage that was taken out on this home.
Original Mortgage
$122,900
Interest Rate
6.04%
Mortgage Type
Fannie Mae Freddie Mac
Purchase Details
Closed on
Nov 1, 2002
Sold by
Edwards Alice and Reed Trudy
Bought by
Minor R Marlene
Home Financials for this Owner
Home Financials are based on the most recent Mortgage that was taken out on this home.
Original Mortgage
$108,800
Interest Rate
6.08%
Purchase Details
Closed on
Jul 15, 1997
Sold by
Bovy Kathleen C
Bought by
Edwards Alice and Reed Trudy
Create a Home Valuation Report for This Property
The Home Valuation Report is an in-depth analysis detailing your home's value as well as a comparison with similar homes in the area
Home Values in the Area
Average Home Value in this Area
Purchase History
| Date | Buyer | Sale Price | Title Company |
|---|---|---|---|
| Burk Rhonda G | $173,000 | Baird & Wamer Title Svcs Inc | |
| Minor R Marlene | $136,000 | Midwest Title Services Llc | |
| Edwards Alice | $99,500 | -- |
Source: Public Records
Mortgage History
| Date | Status | Borrower | Loan Amount |
|---|---|---|---|
| Previous Owner | Burk Rhonda G | $122,900 | |
| Previous Owner | Minor R Marlene | $108,800 | |
| Closed | Minor R Marlene | $13,550 |
Source: Public Records
Tax History
| Year | Tax Paid | Tax Assessment Tax Assessment Total Assessment is a certain percentage of the fair market value that is determined by local assessors to be the total taxable value of land and additions on the property. | Land | Improvement |
|---|---|---|---|---|
| 2024 | $3,838 | $58,806 | $6,203 | $52,603 |
| 2023 | $3,633 | $54,130 | $5,710 | $48,420 |
| 2022 | $3,371 | $48,810 | $5,390 | $43,420 |
| 2021 | $3,364 | $47,650 | $5,260 | $42,390 |
| 2020 | $3,394 | $47,200 | $5,210 | $41,990 |
| 2019 | $3,297 | $45,950 | $5,070 | $40,880 |
| 2018 | $2,986 | $41,750 | $4,780 | $36,970 |
| 2017 | $2,575 | $37,830 | $4,330 | $33,500 |
| 2016 | $2,522 | $36,320 | $4,160 | $32,160 |
| 2015 | $2,486 | $34,650 | $3,970 | $30,680 |
| 2014 | $2,727 | $36,940 | $4,040 | $32,900 |
| 2013 | $2,645 | $37,050 | $4,050 | $33,000 |
Source: Public Records
Map
Nearby Homes
- 1720 Lakecliffe Dr Unit A
- 1705 Lakecliffe Dr Unit D
- 23W160 Woodcroft Dr
- 953 Cordova Ct
- 1265 Windsor Dr
- 1678 Groton Ct
- 1129 Rhodes Ct
- 1581 Groton Ln
- 1580 College Ln S
- 429 Sandhurst Cir Unit 1
- 448 Raintree Ct Unit 1C
- 1601 Castbourne Ct
- 570 Riva Ct
- 453 Raintree Dr Unit 5A
- 453 Raintree Dr Unit 1H
- 440 Raintree Ct Unit 1G
- 470 Fawell Blvd Unit 510
- 470 Fawell Blvd Unit 203
- 840 Sheldon Ct Unit B
- 478 Raintree Ct Unit 2B
- 1760 Plymouth Ct Unit A
- 1732 Harrow Ct Unit 1105C
- 1661 Dover Ct Unit B
- 1651 Dover Ct Unit C
- 1706 Lakecliffe Dr Unit C
- 1782 Gloucester Ct Unit C
- 1779 Gloucester Ct Unit 3103
- 1827 Briarcliffe Blvd Unit A
- 1709 Lakecliffe Dr Unit A
- 1758 Plymouth Ct Unit B
- 1753 Plymouth Ct Unit C
- 1760 Plymouth Ct Unit B
- 1709 Lakecliffe Dr Unit D
- 1657 Dover Ct Unit D
- 1779 Gloucester Ct Unit B
- 1735 Harrow Ct Unit D
- 1702 Lakecliffe Dr Unit B
- 1827 Briarcliffe Blvd Unit D
- 1706 Lakecliffe Dr Unit B
Your Personal Tour Guide
Ask me questions while you tour the home.