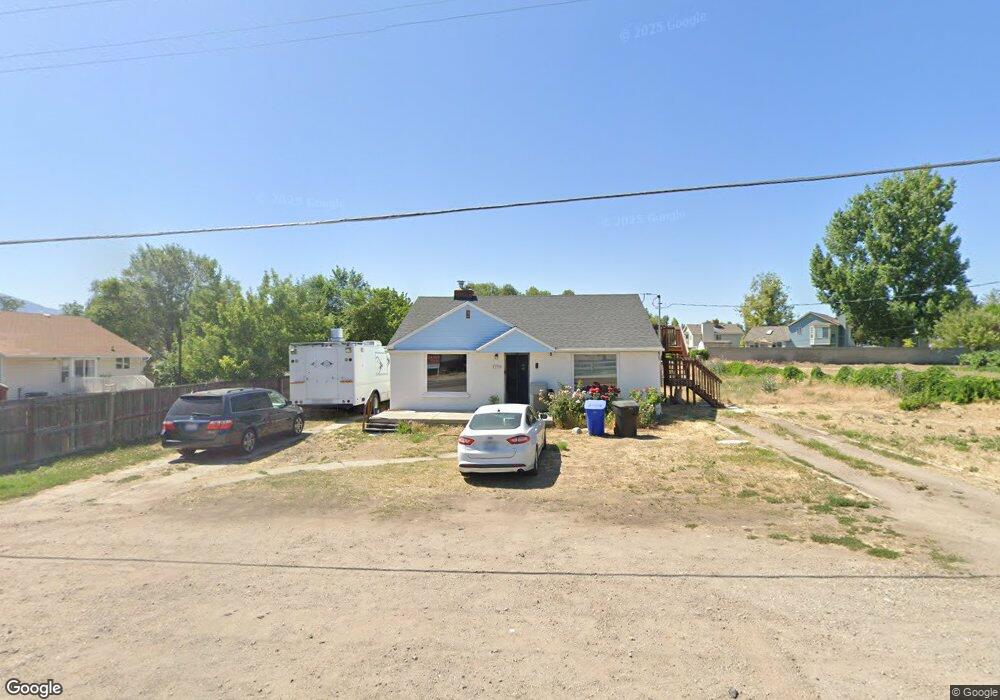
1779 W Sugar Factory Rd West Jordan, UT 84088
Estimated Value: $443,000 - $591,000
4
Beds
2
Baths
1,869
Sq Ft
$259/Sq Ft
Est. Value
About This Home
This home is located at 1779 W Sugar Factory Rd, West Jordan, UT 84088 and is currently estimated at $484,411, approximately $259 per square foot. 1779 W Sugar Factory Rd is a home located in Salt Lake County with nearby schools including Westvale Elementary School, West Jordan Middle School, and West Jordan High School.
Ownership History
Date
Name
Owned For
Owner Type
Purchase Details
Closed on
Feb 9, 2023
Sold by
Edwin F And Dessa Lynn Fountaine Living
Bought by
Hi Utah Properties Llc
Current Estimated Value
Purchase Details
Closed on
Jul 1, 2022
Sold by
Fountaine Edwin F and Fountaine Dessa L
Bought by
Edwin F And Dessa Lynn Fountaine Living Trust
Purchase Details
Closed on
Jan 19, 1996
Sold by
Timothy Ferris J
Bought by
Fountaine Edwin F and Fountaine Dessa L
Home Financials for this Owner
Home Financials are based on the most recent Mortgage that was taken out on this home.
Original Mortgage
$108,459
Interest Rate
7.5%
Mortgage Type
VA
Purchase Details
Closed on
Nov 15, 1993
Sold by
Timothy Ferris J
Bought by
Timothy Ferris J
Home Financials for this Owner
Home Financials are based on the most recent Mortgage that was taken out on this home.
Original Mortgage
$50,178
Interest Rate
7.09%
Mortgage Type
FHA
Create a Home Valuation Report for This Property
The Home Valuation Report is an in-depth analysis detailing your home's value as well as a comparison with similar homes in the area
Home Values in the Area
Average Home Value in this Area
Purchase History
| Date | Buyer | Sale Price | Title Company |
|---|---|---|---|
| Hi Utah Properties Llc | -- | Title One | |
| Edwin F And Dessa Lynn Fountaine Living Trust | -- | Joseph S Huey Pllc | |
| Fountaine Edwin F | -- | -- | |
| Timothy Ferris J | -- | -- | |
| Timothy Ferris J | -- | -- |
Source: Public Records
Mortgage History
| Date | Status | Borrower | Loan Amount |
|---|---|---|---|
| Previous Owner | Fountaine Edwin F | $108,459 | |
| Previous Owner | Timothy Ferris J | $50,178 |
Source: Public Records
Tax History Compared to Growth
Tax History
| Year | Tax Paid | Tax Assessment Tax Assessment Total Assessment is a certain percentage of the fair market value that is determined by local assessors to be the total taxable value of land and additions on the property. | Land | Improvement |
|---|---|---|---|---|
| 2025 | $2,005 | $402,000 | $227,300 | $174,700 |
| 2024 | $2,005 | $385,700 | $209,700 | $176,000 |
| 2023 | $2,010 | $364,500 | $197,800 | $166,700 |
| 2022 | $2,074 | $369,900 | $193,900 | $176,000 |
| 2021 | $1,778 | $288,800 | $156,400 | $132,400 |
| 2020 | $1,667 | $254,000 | $156,400 | $97,600 |
| 2019 | $1,621 | $242,200 | $156,400 | $85,800 |
| 2018 | $0 | $224,300 | $114,700 | $109,600 |
| 2017 | $1,432 | $211,400 | $114,700 | $96,700 |
| 2016 | $1,357 | $188,100 | $114,700 | $73,400 |
| 2015 | $1,232 | $166,500 | $120,100 | $46,400 |
| 2014 | $1,140 | $151,800 | $111,400 | $40,400 |
Source: Public Records
Map
Nearby Homes
- 1790 W Sugar Factory Rd
- 1689 W 8295 S Unit 2
- 8155 S Redwood Rd Unit 88
- 8155 S Redwood Rd Unit 142B
- 8155 S Redwood Rd Unit 95
- 8155 S Redwood Rd Unit 28
- 8510 S Redwood Rd
- 8518 S Redwood Rd
- 8534 S Redwood Rd
- 8383 S 2200 W
- 8140 S 2245 W
- 48 San Rafael Ct
- 8026 Laguna Cir
- 77 Rio Bravo Place
- 1434 Autumn Oak Cir
- 7693 S Redwood Rd
- 8461 S 2385 W
- 2497 Bueno Vista Dr
- 1633 W Rockaway Ln
- 1805 W 7600 S Unit D204
- 1779 W 8200 S
- 8212 S 1750 W
- 8226 S 1750 W Unit 8228
- 8193 Old Factory Dr
- 1847 Sugar Factory Rd
- 1790 W 8200 Rd S
- 8191 Old Factory Dr
- 8191 S Old Factory Dr
- 8230 S 1750 W
- 1844 W 8250 S
- 1780 W 8200 S
- 8187 Old Factory Dr
- 8196 S Old Factory Dr
- 8196 Old Factory Dr
- 8196 Old Factory Dr Unit 901
- 8209 S 1750 W Unit 8213
- 1780 W Sugar Factory Rd
- 1760 W Sugar Factory Rd
- 8183 S Old Factory Dr
- 8183 Old Factory Dr