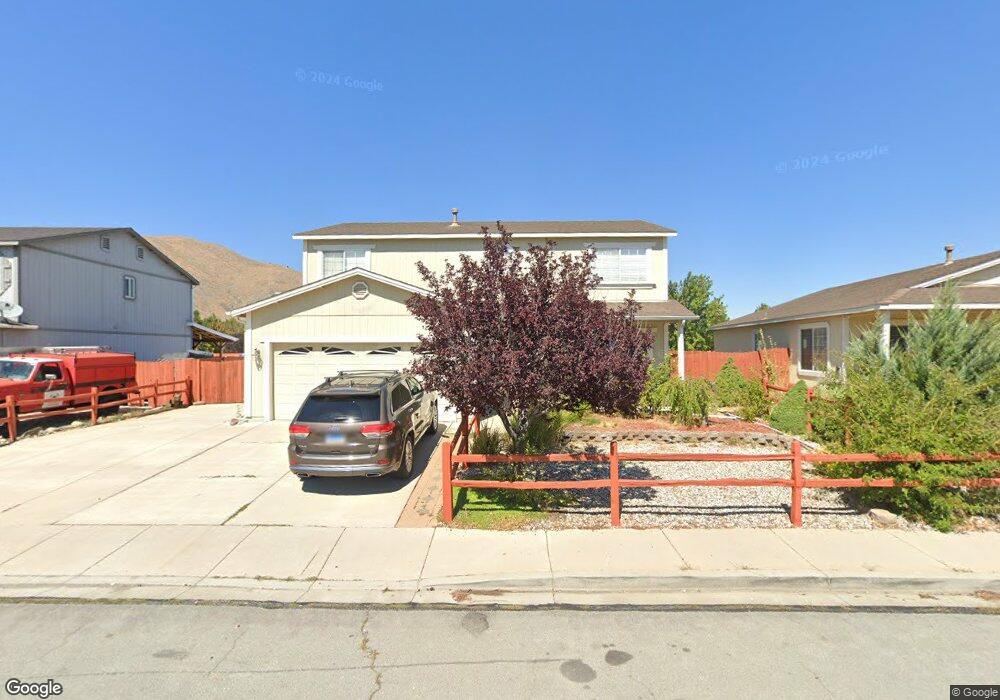
17795 Oakview Ct Unit NV Reno, NV 89508
Cold Springs NeighborhoodEstimated Value: $492,000 - $519,000
4
Beds
3
Baths
2,320
Sq Ft
$218/Sq Ft
Est. Value
About This Home
This home is located at 17795 Oakview Ct Unit NV, Reno, NV 89508 and is currently estimated at $505,592, approximately $217 per square foot. 17795 Oakview Ct Unit NV is a home located in Washoe County with nearby schools including Cold Springs Middle Schools and North Valleys High School.
Ownership History
Date
Name
Owned For
Owner Type
Purchase Details
Closed on
May 26, 2021
Sold by
Terrill Mark Allen and Terrill Tohanna
Bought by
Bender Ronald Jay
Current Estimated Value
Home Financials for this Owner
Home Financials are based on the most recent Mortgage that was taken out on this home.
Original Mortgage
$372,000
Outstanding Balance
$336,800
Interest Rate
2.9%
Mortgage Type
New Conventional
Estimated Equity
$168,792
Purchase Details
Closed on
Sep 27, 2017
Sold by
Terrill Mark Allen
Bought by
Terrill Mark Allen and Terrill Johanna
Purchase Details
Closed on
Feb 4, 2016
Sold by
Rosenberry Jeoffrey G and Rosenberry Cyndy
Bought by
Terrill Mark
Purchase Details
Closed on
Oct 29, 2003
Sold by
Woodland Village 2002 Llc
Bought by
Rosenberry Jeoffrey C and Rosenberry Cyndy
Home Financials for this Owner
Home Financials are based on the most recent Mortgage that was taken out on this home.
Original Mortgage
$151,800
Interest Rate
5.37%
Mortgage Type
Unknown
Create a Home Valuation Report for This Property
The Home Valuation Report is an in-depth analysis detailing your home's value as well as a comparison with similar homes in the area
Home Values in the Area
Average Home Value in this Area
Purchase History
| Date | Buyer | Sale Price | Title Company |
|---|---|---|---|
| Bender Ronald Jay | $465,000 | First American Title Reno | |
| Terrill Mark Allen | -- | None Available | |
| Terrill Mark | $264,500 | Western Title Company | |
| Rosenberry Jeoffrey C | $519,333 | First American Title |
Source: Public Records
Mortgage History
| Date | Status | Borrower | Loan Amount |
|---|---|---|---|
| Open | Bender Ronald Jay | $372,000 | |
| Previous Owner | Rosenberry Jeoffrey C | $151,800 | |
| Closed | Rosenberry Jeoffrey C | $28,450 |
Source: Public Records
Tax History Compared to Growth
Tax History
| Year | Tax Paid | Tax Assessment Tax Assessment Total Assessment is a certain percentage of the fair market value that is determined by local assessors to be the total taxable value of land and additions on the property. | Land | Improvement |
|---|---|---|---|---|
| 2025 | $1,887 | $115,438 | $33,320 | $82,118 |
| 2024 | $1,887 | $109,900 | $27,020 | $82,880 |
| 2023 | $1,833 | $104,836 | $31,080 | $73,756 |
| 2022 | $1,779 | $87,516 | $26,250 | $61,266 |
| 2021 | $1,783 | $81,935 | $21,035 | $60,900 |
| 2020 | $1,676 | $81,134 | $20,125 | $61,009 |
| 2019 | $1,595 | $77,696 | $18,970 | $58,726 |
| 2018 | $1,522 | $71,299 | $13,755 | $57,544 |
| 2017 | $1,461 | $70,287 | $12,565 | $57,722 |
| 2016 | $1,425 | $69,145 | $11,410 | $57,735 |
| 2015 | $1,421 | $65,643 | $9,275 | $56,368 |
| 2014 | $1,380 | $50,892 | $7,420 | $43,472 |
| 2013 | -- | $41,342 | $5,250 | $36,092 |
Source: Public Records
Map
Nearby Homes
- 17795 Oakview Ct
- 18204 Cedar View Dr
- 17870 Fairfax Ct
- 17710 Fairfax Ct
- 18197 Almondleaf Ct
- 4040 Goldfinch Dr
- 17855 Blackbird Dr
- 18119 Cherryleaf Ct
- 17640 Lake Powell Dr
- 18520 Silverbell Ct
- Home Plan 1731 at Woodland Village
- Home Plan 2291 at Woodland Village
- Home Plan 1977 at Woodland Village
- Home Plan 2304 at Woodland Village
- 18697 Ginny Creek Ct
- 4000 Bobolink Cir
- 18260 Alderwood Ct
- 17507 Bear Lake Dr
- 1075 W Slab Cliffs Ct
- 3935 Rainier Ct
- 17795 Oakview Ct
- 17785 Oakview Ct
- 17805 Oakview Ct
- 17775 Oakview Ct
- 17815 Oakview Ct
- 17790 Oakview Ct
- 17800 Oakview Ct
- 17780 Oakview Ct
- 17810 Oakview Ct
- 17765 Oakview Ct
- 17825 Oakview Ct
- 17770 Oakview Ct
- 18185 Morning Breeze Ct
- 17820 Oakview Ct
- 17755 Oakview Ct
- 17805 Boxelder Ct
- 18191 Morning Breeze Ct
- 17760 Oakview Ct
- 17795 Boxelder Ct
- 17815 Boxelder Ct