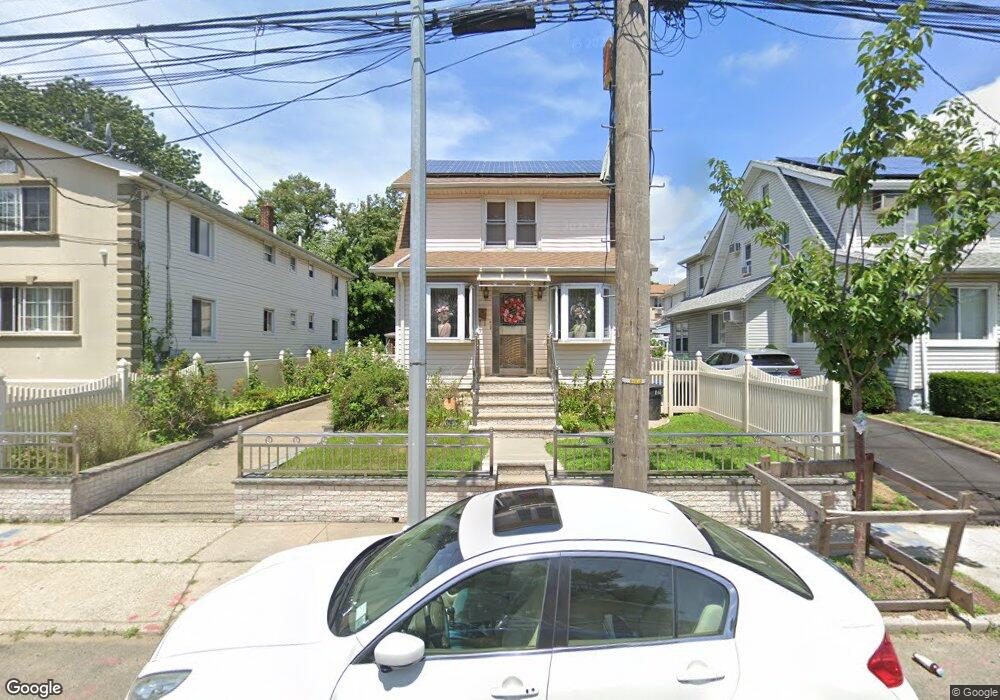
178-11 119th Rd Jamaica, NY 11434
Saint Albans NeighborhoodEstimated Value: $655,000 - $699,000
2
Beds
2
Baths
1,154
Sq Ft
$585/Sq Ft
Est. Value
About This Home
This home is located at 178-11 119th Rd, Jamaica, NY 11434 and is currently estimated at $674,627, approximately $584 per square foot. 178-11 119th Rd is a home located in Queens County with nearby schools including Ps 36 St Albans School, Is 59 Springfield Gardens, and Rochdale Early Advantage Charter School.
Ownership History
Date
Name
Owned For
Owner Type
Purchase Details
Closed on
Jun 18, 2020
Sold by
Lawrence Litwack Esq
Bought by
Assanah Eon and Barker Nichola
Current Estimated Value
Home Financials for this Owner
Home Financials are based on the most recent Mortgage that was taken out on this home.
Original Mortgage
$469,342
Outstanding Balance
$414,193
Interest Rate
3.2%
Mortgage Type
New Conventional
Estimated Equity
$260,434
Purchase Details
Closed on
Dec 14, 2007
Sold by
Lee Deceased Horace A and Vargas Lee
Bought by
Vargas Lee Mildred and Williams Walter R
Purchase Details
Closed on
Jan 23, 1995
Sold by
Lee William D
Bought by
Lee Horace A and Lee Mildred Vargas
Home Financials for this Owner
Home Financials are based on the most recent Mortgage that was taken out on this home.
Original Mortgage
$98,250
Interest Rate
8.55%
Create a Home Valuation Report for This Property
The Home Valuation Report is an in-depth analysis detailing your home's value as well as a comparison with similar homes in the area
Home Values in the Area
Average Home Value in this Area
Purchase History
| Date | Buyer | Sale Price | Title Company |
|---|---|---|---|
| Assanah Eon | $484,787 | -- | |
| Assanah Eon | $484,787 | -- | |
| Assanah Eon | $484,787 | -- | |
| Vargas Lee Mildred | -- | -- | |
| Vargas Lee Mildred | -- | -- | |
| Lee Horace A | $78,000 | Commonwealth Land Title Ins | |
| Lee Horace A | -- | Commonwealth Land Title Ins |
Source: Public Records
Mortgage History
| Date | Status | Borrower | Loan Amount |
|---|---|---|---|
| Open | Assanah Eon | $469,342 | |
| Closed | Assanah Eon | $469,342 | |
| Previous Owner | Lee Horace A | $98,250 | |
| Closed | Vargas Lee Mildred | $0 |
Source: Public Records
Tax History Compared to Growth
Tax History
| Year | Tax Paid | Tax Assessment Tax Assessment Total Assessment is a certain percentage of the fair market value that is determined by local assessors to be the total taxable value of land and additions on the property. | Land | Improvement |
|---|---|---|---|---|
| 2025 | $5,721 | $29,860 | $7,926 | $21,934 |
| 2024 | $5,721 | $28,483 | $8,285 | $20,198 |
| 2023 | $5,397 | $26,873 | $8,084 | $18,789 |
| 2022 | $5,265 | $34,800 | $11,100 | $23,700 |
| 2021 | $5,237 | $32,220 | $11,100 | $21,120 |
| 2020 | $3,962 | $29,220 | $11,100 | $18,120 |
| 2019 | $3,664 | $27,780 | $11,100 | $16,680 |
| 2018 | $4,267 | $22,394 | $8,740 | $13,654 |
| 2017 | $4,181 | $21,979 | $9,241 | $12,738 |
| 2016 | $1,763 | $21,979 | $9,241 | $12,738 |
| 2015 | $1,031 | $20,736 | $11,095 | $9,641 |
| 2014 | $1,031 | $19,780 | $10,289 | $9,491 |
Source: Public Records
Map
Nearby Homes
- 119-48 178th St
- 119-72 178th St
- 11984 178th Place
- 11819 179th St
- 179-01 120th Ave
- 119-60 177th St
- 176-43 120th Ave
- 176-27 Sunbury Rd
- 17715 Troutville Rd
- 186-02 Foch Blvd
- 17710 Troutville Rd
- 12126 Irwin Place
- 17955 Anderson Rd
- 18822 119th Ave
- 17918 Selover Rd
- 17720 Leslie Rd
- 11942 189th St
- 174-41 125th Ave
- 119-73 Merrill St
- 179-47 Zoller Rd
- 17811 119th Rd
- 17807 119th Rd
- 178-07 119th Rd
- 17815 119th Rd
- 17803 119th Rd
- 17819 119th Rd
- 178-19 119th Rd
- 17819 119th Rd
- 178-41 119 Rd
- 11922 178th Place
- 17753 119th Rd
- 17810 119th Rd
- 17812 119th Rd
- 17806 119th Rd
- 178-02 119th Rd
- 11944 178th Place
- 11918 178th Place
- 17802 119th Rd
- 119-18 178th Place
- 119-18 178th Place Unit 2nd FL