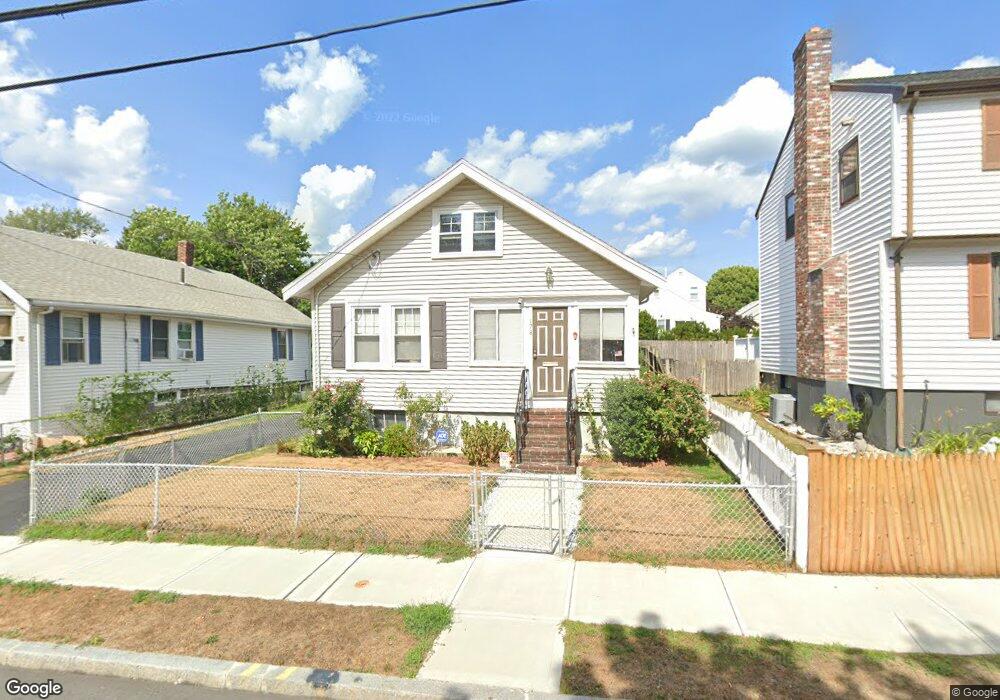
178 Belmont St Quincy, MA 02170
Wollaston NeighborhoodEstimated Value: $591,000 - $660,000
2
Beds
1
Bath
888
Sq Ft
$691/Sq Ft
Est. Value
About This Home
This home is located at 178 Belmont St, Quincy, MA 02170 and is currently estimated at $613,262, approximately $690 per square foot. 178 Belmont St is a home located in Norfolk County with nearby schools including Montclair Elementary School, Atlantic Middle School, and North Quincy High School.
Ownership History
Date
Name
Owned For
Owner Type
Purchase Details
Closed on
Nov 16, 2010
Sold by
Stock Daniel J and Stock Donna M
Bought by
Guan Sufang and Luo Jing T
Current Estimated Value
Home Financials for this Owner
Home Financials are based on the most recent Mortgage that was taken out on this home.
Original Mortgage
$180,000
Outstanding Balance
$118,781
Interest Rate
4.35%
Mortgage Type
Purchase Money Mortgage
Estimated Equity
$494,481
Create a Home Valuation Report for This Property
The Home Valuation Report is an in-depth analysis detailing your home's value as well as a comparison with similar homes in the area
Home Values in the Area
Average Home Value in this Area
Purchase History
| Date | Buyer | Sale Price | Title Company |
|---|---|---|---|
| Guan Sufang | $280,000 | -- |
Source: Public Records
Mortgage History
| Date | Status | Borrower | Loan Amount |
|---|---|---|---|
| Open | Guan Sufang | $180,000 |
Source: Public Records
Tax History Compared to Growth
Tax History
| Year | Tax Paid | Tax Assessment Tax Assessment Total Assessment is a certain percentage of the fair market value that is determined by local assessors to be the total taxable value of land and additions on the property. | Land | Improvement |
|---|---|---|---|---|
| 2025 | $5,958 | $516,700 | $326,200 | $190,500 |
| 2024 | $5,792 | $513,900 | $326,200 | $187,700 |
| 2023 | $5,568 | $500,300 | $310,700 | $189,600 |
| 2022 | $5,366 | $447,900 | $270,200 | $177,700 |
| 2021 | $5,153 | $424,500 | $257,300 | $167,200 |
| 2020 | $4,970 | $399,800 | $257,300 | $142,500 |
| 2019 | $4,690 | $373,700 | $240,500 | $133,200 |
| 2018 | $4,613 | $345,800 | $222,700 | $123,100 |
| 2017 | $4,632 | $326,900 | $212,100 | $114,800 |
| 2016 | $4,220 | $293,900 | $184,400 | $109,500 |
| 2015 | $3,873 | $265,300 | $167,600 | $97,700 |
| 2014 | $3,702 | $249,100 | $159,600 | $89,500 |
Source: Public Records
Map
Nearby Homes
- 250 Fayette St
- 143 Arlington St
- 129-131 Pine St
- 169 Pine St
- 45 Marion St
- 121 Hillside Ave
- 171 Milton St
- 100 Grandview Ave Unit 11A
- 11 Earle St
- 111 Warren Ave Unit 1F
- 11 Rockwell Ave
- 18 Eaton St
- 65 Barham Ave
- 115 W Squantum St Unit 907
- 115 W Squantum St Unit 810
- 465 Newport Ave
- 17 Holmes St Unit 2
- 17 Holmes St Unit 4
- 22 Newton Ave
- 163 Clay St Unit C
- 182 Belmont St
- 174 Belmont St
- 161 Highland Ave
- 165 Highland Ave
- 186 Belmont St
- 170 Belmont St
- 157 Highland Ave
- 169 Highland Ave
- 177 Belmont St
- 181 Belmont St
- 153 Highland Ave
- 171 Belmont St
- 188 Belmont St
- 166 Belmont St
- 183 Belmont St
- 173 Highland Ave
- 149 Highland Ave
- 187 Belmont St
- 167 Belmont St
- 192 Belmont St