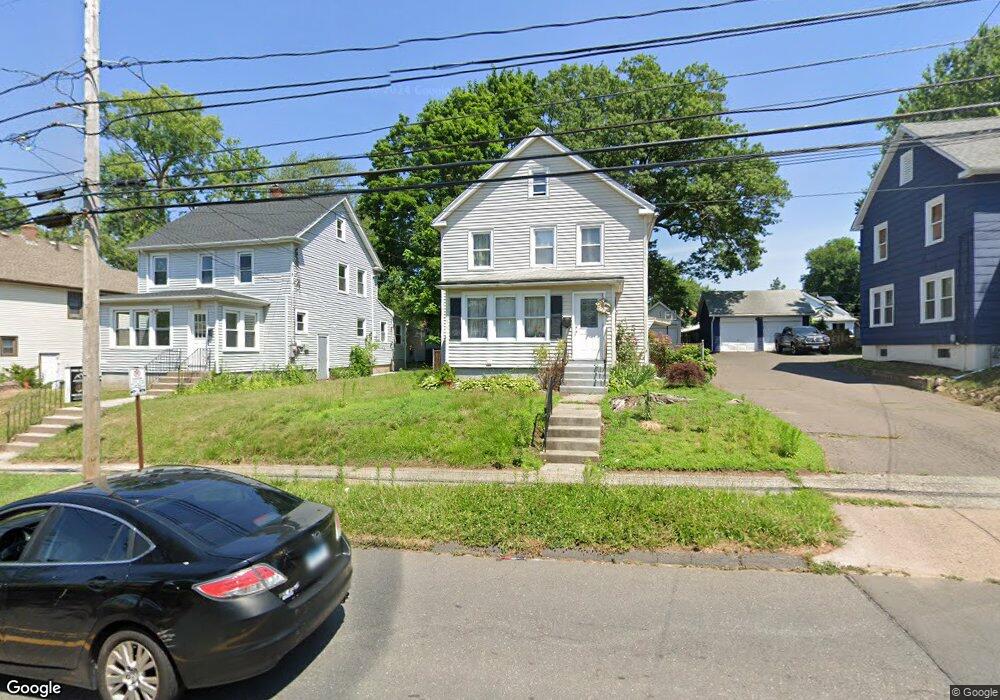
178 Burnham St Hartford, CT 06112
Blue Hills NeighborhoodEstimated Value: $185,000 - $261,000
3
Beds
1
Bath
1,308
Sq Ft
$181/Sq Ft
Est. Value
About This Home
This home is located at 178 Burnham St, Hartford, CT 06112 and is currently estimated at $236,314, approximately $180 per square foot. 178 Burnham St is a home located in Hartford County with nearby schools including Rawson School, Noah Webster Micro Society School, and McKinley School.
Ownership History
Date
Name
Owned For
Owner Type
Purchase Details
Closed on
Jan 7, 2010
Sold by
Department Of Housing & Urban Dev
Bought by
Johnson Janet
Current Estimated Value
Home Financials for this Owner
Home Financials are based on the most recent Mortgage that was taken out on this home.
Original Mortgage
$57,600
Outstanding Balance
$37,338
Interest Rate
4.78%
Mortgage Type
Purchase Money Mortgage
Estimated Equity
$198,976
Purchase Details
Closed on
Sep 21, 2009
Sold by
Us Bk
Bought by
Department Of Housing & Urban Dev
Purchase Details
Closed on
Mar 24, 2009
Sold by
Stewart Merline
Bought by
Us Bank Na
Purchase Details
Closed on
Sep 8, 2003
Sold by
Sweeney Alma
Bought by
Stewart Merline and Stewart Nathan
Home Financials for this Owner
Home Financials are based on the most recent Mortgage that was taken out on this home.
Original Mortgage
$131,341
Interest Rate
6.02%
Mortgage Type
Purchase Money Mortgage
Purchase Details
Closed on
Apr 12, 2001
Sold by
N Main Llc
Bought by
Sweeney Alma
Create a Home Valuation Report for This Property
The Home Valuation Report is an in-depth analysis detailing your home's value as well as a comparison with similar homes in the area
Home Values in the Area
Average Home Value in this Area
Purchase History
| Date | Buyer | Sale Price | Title Company |
|---|---|---|---|
| Johnson Janet | $72,000 | -- | |
| Department Of Housing & Urban Dev | -- | -- | |
| Us Bank Na | -- | -- | |
| Stewart Merline | $133,000 | -- | |
| Sweeney Alma | $40,000 | -- |
Source: Public Records
Mortgage History
| Date | Status | Borrower | Loan Amount |
|---|---|---|---|
| Open | Sweeney Alma | $57,600 | |
| Previous Owner | Sweeney Alma | $131,341 | |
| Previous Owner | Sweeney Alma | $4,800 |
Source: Public Records
Tax History Compared to Growth
Tax History
| Year | Tax Paid | Tax Assessment Tax Assessment Total Assessment is a certain percentage of the fair market value that is determined by local assessors to be the total taxable value of land and additions on the property. | Land | Improvement |
|---|---|---|---|---|
| 2025 | $4,049 | $58,727 | $4,888 | $53,839 |
| 2024 | $4,049 | $58,727 | $4,888 | $53,839 |
| 2023 | $4,049 | $58,727 | $4,888 | $53,839 |
| 2022 | $4,049 | $58,727 | $4,888 | $53,839 |
| 2021 | $3,008 | $40,495 | $5,810 | $34,685 |
| 2020 | $3,008 | $40,495 | $5,810 | $34,685 |
| 2019 | $3,008 | $40,495 | $5,810 | $34,685 |
| 2018 | $2,907 | $39,130 | $5,614 | $33,516 |
| 2016 | $3,029 | $40,778 | $5,347 | $35,431 |
| 2015 | $3,029 | $38,841 | $5,093 | $33,748 |
| 2014 | $2,815 | $37,891 | $4,968 | $32,923 |
Source: Public Records
Map
Nearby Homes
- 147 Morningside St W
- 171 N Canaan St
- 180 Brookline Ave
- 70 Burnham St Unit 72
- 77 Harold St
- 86 Hartland St
- 179 Manchester St
- 90 Manchester St
- 355 Cornwall St Unit 357
- 125 Lebanon St Unit 127
- 11 Pershing St Unit 13
- 181 Westminster St
- 30 Harding Ave
- 10 Baltic St Unit 12
- 36 Baltic St Unit 38
- 218 Holcomb St Unit 220
- 97 E Burnham St
- 53 Hillcrest Ave
- 67 Elizabeth Ave
- 211 Holcomb St Unit 213
- 174 Burnham St
- 182 Burnham St
- 186 Burnham St
- 168 Burnham St
- 177 Euclid St W
- 181 Euclid St W
- 169 Euclid St W
- 179 Burnham St
- 175 Burnham St
- 194 Burnham St
- 420 Lyme St
- 171 Burnham St
- 164 Burnham St
- 189 Euclid St W
- 165 Burnham St
- 161 Euclid St W
- 160 Burnham St
- 161 Burnham St
- 191 Euclid St W
- 198 Burnham St