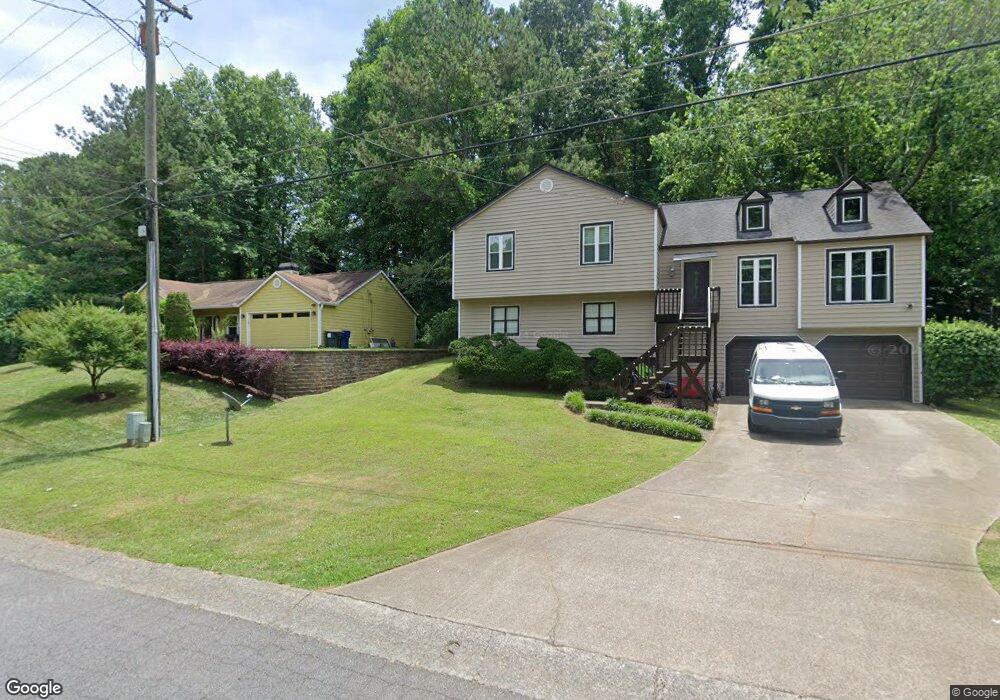
178 Colemans Bluff Dr Unit U2 Woodstock, GA 30188
Estimated Value: $395,000 - $407,190
3
Beds
2
Baths
2,253
Sq Ft
$178/Sq Ft
Est. Value
About This Home
This home is located at 178 Colemans Bluff Dr Unit U2, Woodstock, GA 30188 and is currently estimated at $401,095, approximately $178 per square foot. 178 Colemans Bluff Dr Unit U2 is a home located in Cherokee County with nearby schools including Little River Elementary, Mill Creek Middle School, and River Ridge High School.
Ownership History
Date
Name
Owned For
Owner Type
Purchase Details
Closed on
Aug 29, 2001
Sold by
Graham Terri S
Bought by
Wolcott Betty F
Current Estimated Value
Home Financials for this Owner
Home Financials are based on the most recent Mortgage that was taken out on this home.
Original Mortgage
$120,420
Outstanding Balance
$45,563
Interest Rate
6.89%
Estimated Equity
$355,532
Purchase Details
Closed on
Jun 30, 1998
Sold by
Richendollar Kevin J and Richendollar Carolee E
Bought by
Graham Terri S
Purchase Details
Closed on
Jul 30, 1997
Sold by
Orr Scott G and Corr Dale H
Bought by
Richendollar Kevin J
Home Financials for this Owner
Home Financials are based on the most recent Mortgage that was taken out on this home.
Original Mortgage
$112,500
Interest Rate
7.61%
Create a Home Valuation Report for This Property
The Home Valuation Report is an in-depth analysis detailing your home's value as well as a comparison with similar homes in the area
Home Values in the Area
Average Home Value in this Area
Purchase History
| Date | Buyer | Sale Price | Title Company |
|---|---|---|---|
| Wolcott Betty F | $133,800 | -- | |
| Graham Terri S | $116,000 | -- | |
| Richendollar Kevin J | $116,000 | -- |
Source: Public Records
Mortgage History
| Date | Status | Borrower | Loan Amount |
|---|---|---|---|
| Open | Wolcott Betty F | $120,420 | |
| Previous Owner | Richendollar Kevin J | $112,500 | |
| Closed | Graham Terri S | -- |
Source: Public Records
Tax History Compared to Growth
Tax History
| Year | Tax Paid | Tax Assessment Tax Assessment Total Assessment is a certain percentage of the fair market value that is determined by local assessors to be the total taxable value of land and additions on the property. | Land | Improvement |
|---|---|---|---|---|
| 2025 | $4,030 | $153,456 | $29,600 | $123,856 |
| 2024 | $3,885 | $149,496 | $29,600 | $119,896 |
| 2023 | $3,744 | $144,056 | $28,000 | $116,056 |
| 2022 | $3,072 | $116,896 | $23,600 | $93,296 |
| 2021 | $2,771 | $97,616 | $18,000 | $79,616 |
| 2020 | $2,502 | $88,060 | $14,400 | $73,660 |
| 2019 | $2,132 | $75,040 | $14,400 | $60,640 |
| 2018 | $1,904 | $66,600 | $12,800 | $53,800 |
| 2017 | $1,909 | $165,600 | $12,800 | $53,440 |
| 2016 | $1,860 | $159,700 | $11,600 | $52,280 |
| 2015 | $1,745 | $148,400 | $10,080 | $49,280 |
| 2014 | $1,594 | $135,300 | $10,080 | $44,040 |
Source: Public Records
Map
Nearby Homes
- 180 Colemans Bluff Dr
- 176 Colemans Bluff Dr
- 329 Pioneer Cir
- 182 Colemans Bluff Dr Unit 2
- 174 Colemans Bluff Dr
- 187 Colemans Bluff Dr
- 183 Colemans Bluff Dr
- 327 Pioneer Cir
- 331 Pioneer Cir
- 333 Pioneer Cir
- 189 Colemans Bluff Dr Unit U2
- 181 Colemans Bluff Dr
- 184 Colemans Bluff Dr
- 172 Colemans Bluff Dr
- 0 Pioneer Cir Unit 8800972
- 0 Pioneer Cir Unit 8360211
- 0 Pioneer Cir Unit 7146516
- 191 Colemans Bluff Dr Unit 2
- 179 Colemans Bluff Dr
- 335 Pioneer Cir