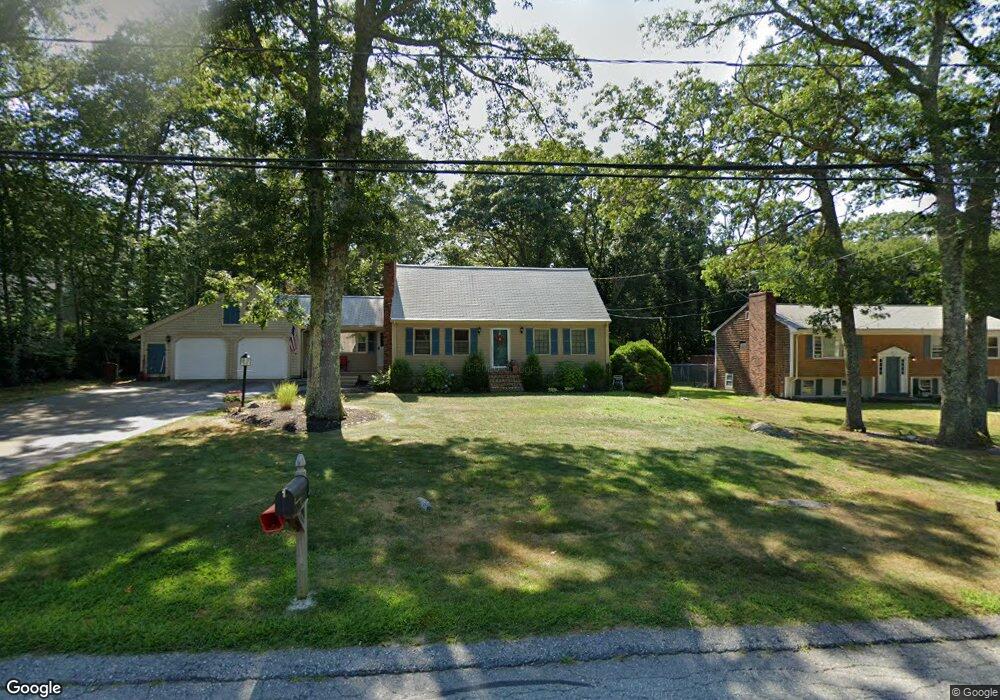
178 Dillon Ln Swansea, MA 02777
West Swansea NeighborhoodEstimated Value: $581,000 - $645,000
3
Beds
3
Baths
1,853
Sq Ft
$326/Sq Ft
Est. Value
About This Home
This home is located at 178 Dillon Ln, Swansea, MA 02777 and is currently estimated at $603,663, approximately $325 per square foot. 178 Dillon Ln is a home located in Bristol County with nearby schools including Joseph Case High School, SCEC Life Academy, and Swansea Wood School.
Ownership History
Date
Name
Owned For
Owner Type
Purchase Details
Closed on
Dec 15, 2017
Sold by
Sigman John A and Sigman Doreen T
Bought by
Sigman John A and Sigman Doreen T
Current Estimated Value
Purchase Details
Closed on
Jun 26, 1970
Bought by
Sigman John A and Sigman Doreen T
Create a Home Valuation Report for This Property
The Home Valuation Report is an in-depth analysis detailing your home's value as well as a comparison with similar homes in the area
Home Values in the Area
Average Home Value in this Area
Purchase History
| Date | Buyer | Sale Price | Title Company |
|---|---|---|---|
| Sigman John A | -- | -- | |
| Sigman John A | -- | -- |
Source: Public Records
Mortgage History
| Date | Status | Borrower | Loan Amount |
|---|---|---|---|
| Previous Owner | Sigman John A | $100,000 | |
| Previous Owner | Sigman John A | $60,000 | |
| Previous Owner | Sigman John A | $21,000 |
Source: Public Records
Tax History Compared to Growth
Tax History
| Year | Tax Paid | Tax Assessment Tax Assessment Total Assessment is a certain percentage of the fair market value that is determined by local assessors to be the total taxable value of land and additions on the property. | Land | Improvement |
|---|---|---|---|---|
| 2025 | $5,579 | $468,000 | $195,000 | $273,000 |
| 2024 | $5,551 | $463,000 | $195,000 | $268,000 |
| 2023 | $5,060 | $385,400 | $143,300 | $242,100 |
| 2022 | $4,790 | $332,900 | $124,500 | $208,400 |
| 2021 | $4,619 | $295,500 | $136,200 | $159,300 |
| 2020 | $4,886 | $313,600 | $148,000 | $165,600 |
| 2019 | $4,189 | $270,100 | $108,200 | $161,900 |
| 2018 | $4,147 | $271,400 | $109,500 | $161,900 |
| 2017 | $3,702 | $278,800 | $109,500 | $169,300 |
| 2016 | $3,325 | $245,900 | $90,100 | $155,800 |
| 2015 | $3,092 | $235,500 | $90,100 | $145,400 |
| 2014 | $2,976 | $231,800 | $90,100 | $141,700 |
Source: Public Records
Map
Nearby Homes