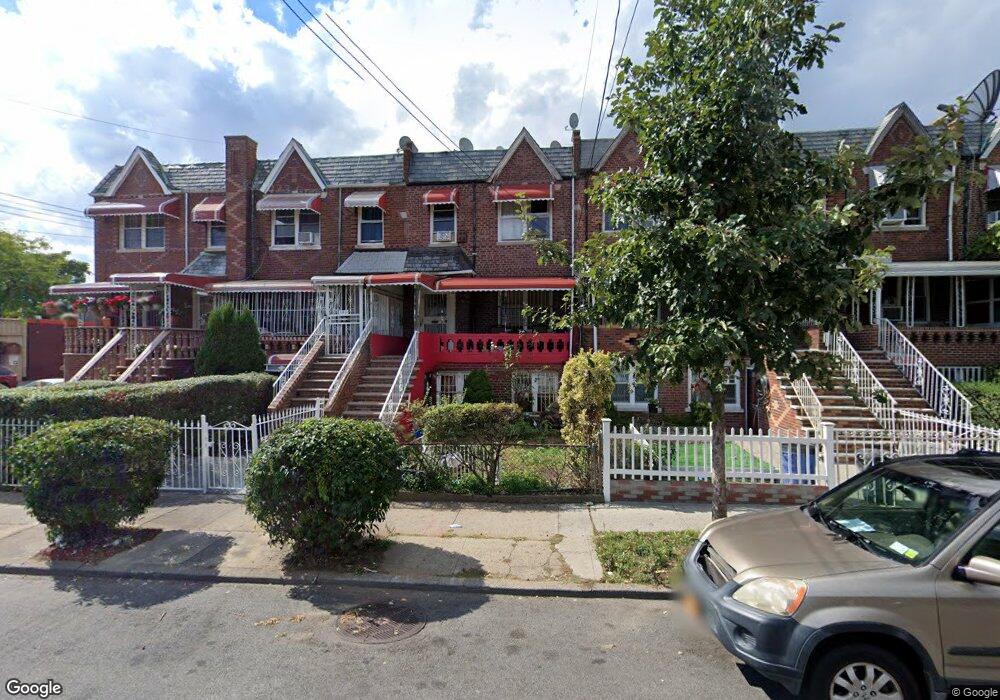
178 E 56th St Brooklyn, NY 11203
East Flatbush NeighborhoodEstimated Value: $883,000 - $1,132,000
5
Beds
3
Baths
2,384
Sq Ft
$422/Sq Ft
Est. Value
About This Home
This home is located at 178 E 56th St, Brooklyn, NY 11203 and is currently estimated at $1,006,667, approximately $422 per square foot. 178 E 56th St is a home located in Kings County with nearby schools including Ps 244 Richard R Green, East Flatbush Community Research School, and Lamad Academy Charter School.
Ownership History
Date
Name
Owned For
Owner Type
Purchase Details
Closed on
Nov 20, 2009
Sold by
Richards Marlane
Bought by
Richards Marlane and Richards Simon
Current Estimated Value
Home Financials for this Owner
Home Financials are based on the most recent Mortgage that was taken out on this home.
Original Mortgage
$459,401
Outstanding Balance
$299,062
Interest Rate
5.02%
Mortgage Type
Purchase Money Mortgage
Estimated Equity
$707,605
Purchase Details
Closed on
Aug 12, 2006
Sold by
Richards Lavine and Richards Marlane
Bought by
Richards Marlane
Purchase Details
Closed on
Mar 12, 1997
Sold by
Fountain Donna
Bought by
Richards Marlane and Richards Lavine
Home Financials for this Owner
Home Financials are based on the most recent Mortgage that was taken out on this home.
Original Mortgage
$183,450
Interest Rate
7.55%
Mortgage Type
FHA
Purchase Details
Closed on
Nov 12, 1994
Sold by
Dixon Kenneth
Bought by
Dixon Kenneth and Dixon Gloria
Create a Home Valuation Report for This Property
The Home Valuation Report is an in-depth analysis detailing your home's value as well as a comparison with similar homes in the area
Home Values in the Area
Average Home Value in this Area
Purchase History
| Date | Buyer | Sale Price | Title Company |
|---|---|---|---|
| Richards Marlane | -- | -- | |
| Richards Marlane | -- | -- | |
| Richards Marlane | -- | -- | |
| Richards Marlane | -- | -- | |
| Richards Marlane | $185,000 | Commonwealth Land Title Ins | |
| Richards Marlane | -- | First American Title Ins Co | |
| Richards Marlane | $185,000 | Commonwealth Land Title Ins | |
| Dixon Kenneth | -- | -- | |
| Dixon Kenneth | -- | -- |
Source: Public Records
Mortgage History
| Date | Status | Borrower | Loan Amount |
|---|---|---|---|
| Open | Richards Marlane | $459,401 | |
| Closed | Richards Marlane | $459,401 | |
| Previous Owner | Richards Marlane | $183,450 |
Source: Public Records
Tax History
| Year | Tax Paid | Tax Assessment Tax Assessment Total Assessment is a certain percentage of the fair market value that is determined by local assessors to be the total taxable value of land and additions on the property. | Land | Improvement |
|---|---|---|---|---|
| 2025 | $6,709 | $36,540 | $15,840 | $20,700 |
| 2024 | $6,709 | $38,460 | $15,840 | $22,620 |
| 2023 | $6,383 | $46,260 | $15,840 | $30,420 |
| 2022 | $5,896 | $37,860 | $15,840 | $22,020 |
| 2021 | $5,853 | $29,220 | $15,840 | $13,380 |
| 2020 | $3,151 | $35,400 | $15,840 | $19,560 |
| 2019 | $6,013 | $33,660 | $15,840 | $17,820 |
| 2018 | $5,500 | $28,440 | $13,455 | $14,985 |
| 2017 | $5,280 | $27,370 | $12,083 | $15,287 |
| 2016 | $5,131 | $27,216 | $13,159 | $14,057 |
| 2015 | $2,895 | $26,280 | $17,580 | $8,700 |
| 2014 | $2,895 | $25,122 | $17,525 | $7,597 |
Source: Public Records
Map
Nearby Homes
- 175 E 55th St
- 886 Linden Blvd Unit 888
- 890 Linden Blvd
- 871 Linden Blvd
- 891 Linden Blvd
- 234 E 54th St
- 5319 Church Ave
- 255 E 55th St
- 814 Linden Blvd
- 895 Lenox Rd
- 5749 Kings Hwy
- 206 E 53rd St
- 5727 Kings Hwy
- 980 Lenox Rd
- 27 E 56th St
- 355 E 51st St
- 343 E 51st St
- 5606 Snyder Ave
- 828 Lenox Rd
- 336 E 91st St Unit 4
- 180 E 56th St
- 182 E 56th St
- 174 E 56th St
- 172 E 56th St
- 5511 Church Ave
- 170 E 56th St
- 5509 Church Ave Unit 2nd Fl
- 5509 Church Ave
- 168 E 56th St
- 5507 Church Ave
- 5505 Church Ave
- 166 E 56th St
- 207 E 55th St
- 5518 Church Ave
- 5501 Church Ave
- 162 E 56th St
- 5601 Church Ave
- 5601 Church Ave
- 171 E 56th St
- 205 E 55th St
Your Personal Tour Guide
Ask me questions while you tour the home.