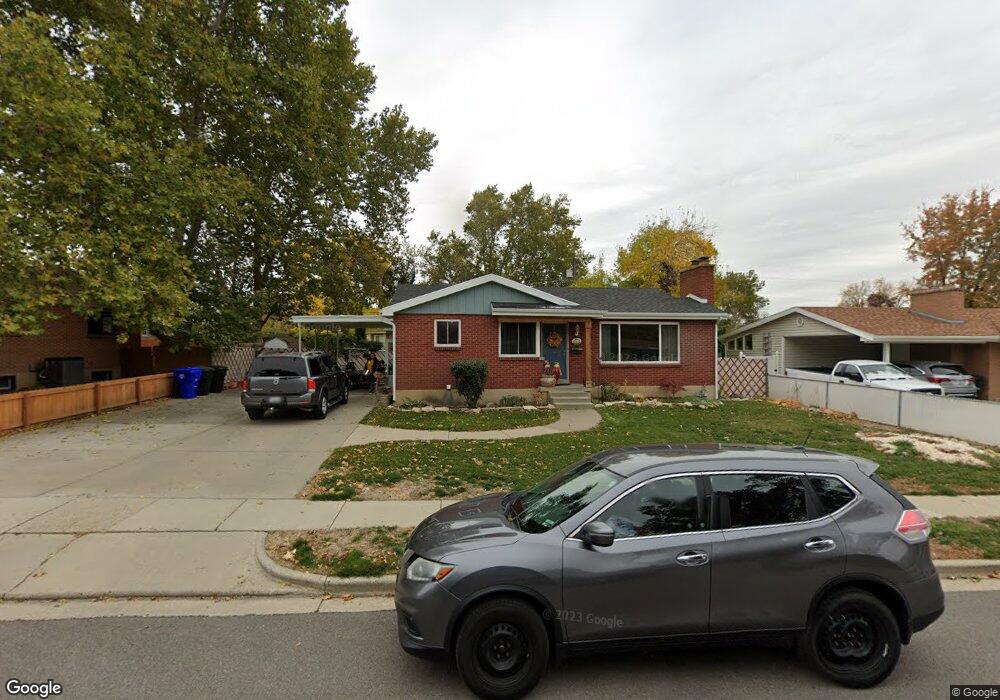
178 E 800 N Bountiful, UT 84010
Estimated Value: $460,000 - $504,843
3
Beds
2
Baths
1,994
Sq Ft
$244/Sq Ft
Est. Value
About This Home
This home is located at 178 E 800 N, Bountiful, UT 84010 and is currently estimated at $485,961, approximately $243 per square foot. 178 E 800 N is a home located in Davis County with nearby schools including Tolman School, Bountiful Junior High School, and Viewmont High School.
Ownership History
Date
Name
Owned For
Owner Type
Purchase Details
Closed on
Feb 7, 2007
Sold by
Pitbladdo Walter
Bought by
Pitbladdo Walter and Pitbladdo Sandra
Current Estimated Value
Home Financials for this Owner
Home Financials are based on the most recent Mortgage that was taken out on this home.
Original Mortgage
$176,000
Outstanding Balance
$104,943
Interest Rate
6.17%
Mortgage Type
Negative Amortization
Estimated Equity
$381,018
Purchase Details
Closed on
Aug 22, 2001
Sold by
Poindester Hugh H and Poindexter Carma K
Bought by
Pitbladdo Walter
Create a Home Valuation Report for This Property
The Home Valuation Report is an in-depth analysis detailing your home's value as well as a comparison with similar homes in the area
Purchase History
| Date | Buyer | Sale Price | Title Company |
|---|---|---|---|
| Pitbladdo Walter | -- | Equity Title Ins Agency Inc | |
| Pitbladdo Walter | -- | Backman Stewart Title Servic |
Source: Public Records
Mortgage History
| Date | Status | Borrower | Loan Amount |
|---|---|---|---|
| Open | Pitbladdo Walter | $176,000 |
Source: Public Records
Tax History
| Year | Tax Paid | Tax Assessment Tax Assessment Total Assessment is a certain percentage of the fair market value that is determined by local assessors to be the total taxable value of land and additions on the property. | Land | Improvement |
|---|---|---|---|---|
| 2025 | $2,728 | $248,050 | $123,558 | $124,492 |
| 2024 | $2,555 | $241,450 | $107,919 | $133,531 |
| 2023 | $2,451 | $420,000 | $200,887 | $219,113 |
| 2022 | $2,603 | $245,300 | $110,330 | $134,970 |
| 2021 | $2,256 | $324,000 | $144,291 | $179,709 |
| 2020 | $1,871 | $268,000 | $124,015 | $143,985 |
| 2019 | $1,899 | $266,000 | $136,245 | $129,755 |
| 2018 | $1,752 | $241,000 | $133,676 | $107,324 |
| 2016 | $1,634 | $122,430 | $53,886 | $68,544 |
| 2015 | $1,642 | $116,380 | $53,886 | $62,494 |
| 2014 | $1,538 | $111,771 | $53,886 | $57,885 |
| 2013 | -- | $98,539 | $41,880 | $56,659 |
Source: Public Records
Map
Nearby Homes
- 453 N 400 E Unit 7-D
- 106 W 700 N
- 1420 N Main St
- 184 Park Shadows Cir
- 345 N 400 E
- 49 E 200 N Unit 4
- 41 E 200 N Unit 6
- 252 N Main St
- 256 N Main St
- 254 N Main St
- 1130 N 200 W
- 55 E 200 N Unit 2
- 51 E 200 N Unit 3
- 1260 N 200 W
- 563 N 200 W
- 499 N 200 W Unit 30
- 320 N 200 W Unit 4
- 332 N 300 W
- 235 W 1400 N
- 662 E 1200 N
Your Personal Tour Guide
Ask me questions while you tour the home.