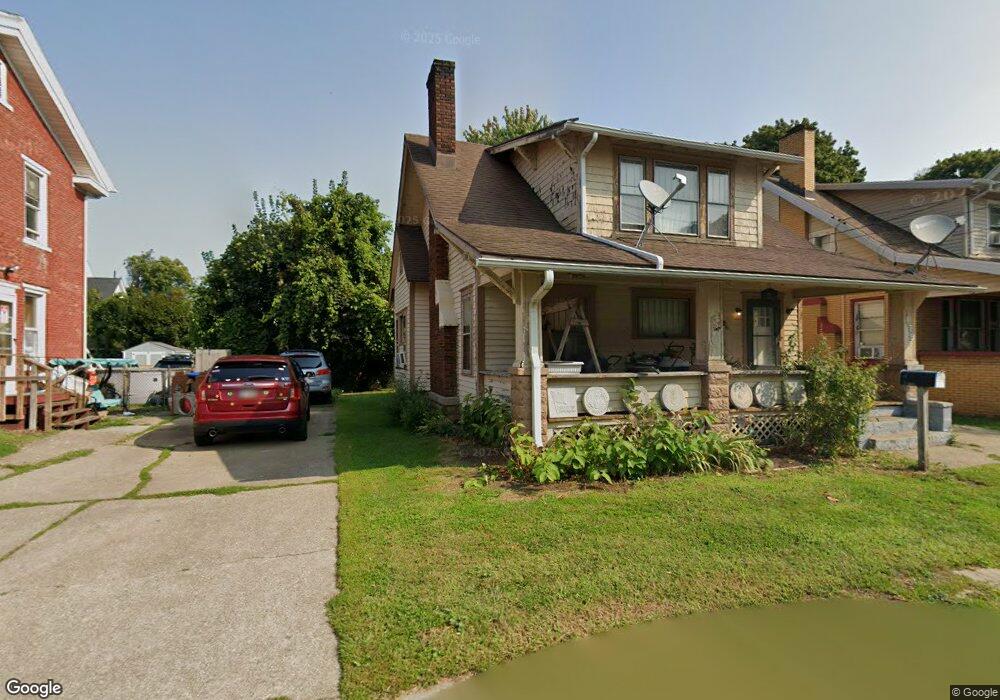
178 Grant St Conneaut, OH 44030
Estimated Value: $45,000 - $51,000
3
Beds
1
Bath
1,116
Sq Ft
$43/Sq Ft
Est. Value
About This Home
This home is located at 178 Grant St, Conneaut, OH 44030 and is currently estimated at $48,293, approximately $43 per square foot. 178 Grant St is a home located in Ashtabula County with nearby schools including Lakeshore Primary Elementary School, Gateway Elementary School, and Conneaut Middle School.
Ownership History
Date
Name
Owned For
Owner Type
Purchase Details
Closed on
Feb 25, 2025
Sold by
Bryant Terrence
Bought by
Thomas Virginia M
Current Estimated Value
Purchase Details
Closed on
Feb 23, 2005
Sold by
Andes Stephen V and Andes Margaret M
Bought by
Bryant Terrence
Home Financials for this Owner
Home Financials are based on the most recent Mortgage that was taken out on this home.
Original Mortgage
$40,970
Interest Rate
5.61%
Mortgage Type
FHA
Create a Home Valuation Report for This Property
The Home Valuation Report is an in-depth analysis detailing your home's value as well as a comparison with similar homes in the area
Home Values in the Area
Average Home Value in this Area
Purchase History
| Date | Buyer | Sale Price | Title Company |
|---|---|---|---|
| Thomas Virginia M | $45,000 | None Listed On Document | |
| Thomas Virginia M | $45,000 | None Listed On Document | |
| Bryant Terrence | $41,295 | Lawyers Title Insurance Corp |
Source: Public Records
Mortgage History
| Date | Status | Borrower | Loan Amount |
|---|---|---|---|
| Previous Owner | Bryant Terrence | $40,970 |
Source: Public Records
Tax History Compared to Growth
Tax History
| Year | Tax Paid | Tax Assessment Tax Assessment Total Assessment is a certain percentage of the fair market value that is determined by local assessors to be the total taxable value of land and additions on the property. | Land | Improvement |
|---|---|---|---|---|
| 2024 | $679 | $9,280 | $1,260 | $8,020 |
| 2023 | $438 | $9,280 | $1,260 | $8,020 |
| 2022 | $412 | $7,670 | $980 | $6,690 |
| 2021 | $419 | $7,670 | $980 | $6,690 |
| 2020 | $419 | $7,670 | $980 | $6,690 |
| 2019 | $421 | $7,570 | $600 | $6,970 |
| 2018 | $401 | $7,570 | $600 | $6,970 |
| 2017 | $473 | $7,570 | $600 | $6,970 |
| 2016 | $539 | $11,240 | $880 | $10,360 |
| 2015 | $545 | $11,240 | $880 | $10,360 |
| 2014 | $790 | $18,560 | $880 | $17,680 |
| 2013 | $401 | $9,630 | $840 | $8,790 |
Source: Public Records
Map
Nearby Homes
- 284 Clay St
- 289 Harbor St
- 146 Nickle Plate Ave
- 179 Marshall St
- 386 Washington St
- 402 Broad St
- 408 Broad State Rd 7 St
- 413 Harbor St
- 427 Harbor St
- 459 Mill St
- 536 Mill St
- 375 Bliss Ave
- 455 Main St
- 264 High St
- 644 Mill St
- 251 St Rt 7
- 622 Harbor St
- 536 Madison St
- 0 Chestnut St Unit 5120761
- 169 River St