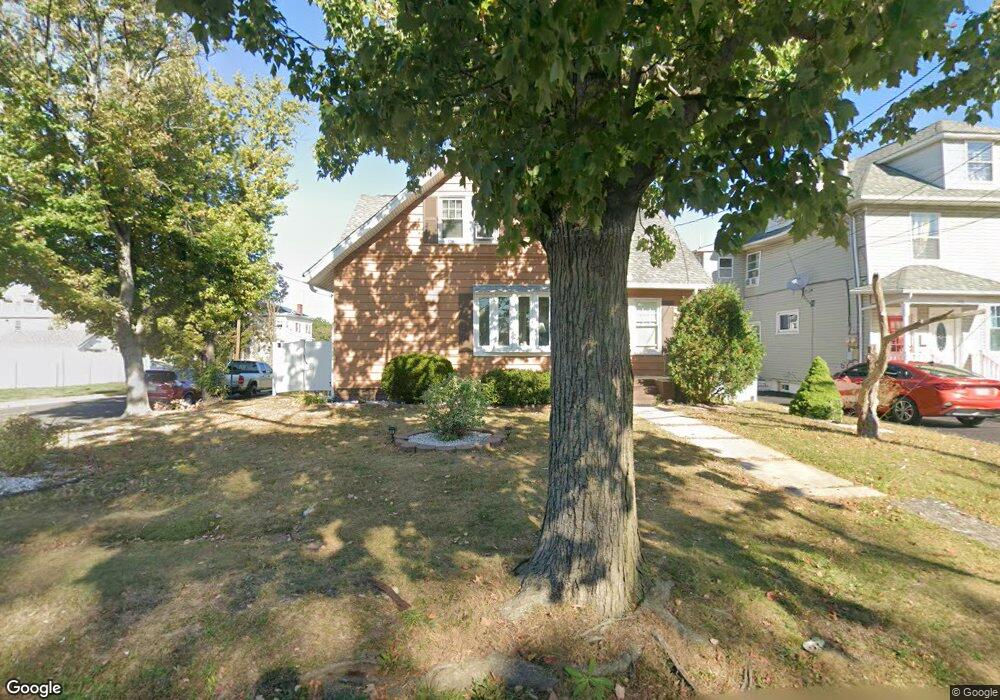
178 Grove St Woodbridge, NJ 07095
Estimated Value: $375,765 - $559,000
4
Beds
2
Baths
966
Sq Ft
$490/Sq Ft
Est. Value
About This Home
This home is located at 178 Grove St, Woodbridge, NJ 07095 and is currently estimated at $473,441, approximately $490 per square foot. 178 Grove St is a home located in Middlesex County with nearby schools including Ross Street Elementary School, Woodbridge Middle School, and Woodbridge High School.
Ownership History
Date
Name
Owned For
Owner Type
Purchase Details
Closed on
Sep 21, 2020
Sold by
Anderson John F
Bought by
Barna Edward and Barna Cheryl
Current Estimated Value
Home Financials for this Owner
Home Financials are based on the most recent Mortgage that was taken out on this home.
Original Mortgage
$325,513
Outstanding Balance
$288,871
Interest Rate
2.9%
Mortgage Type
New Conventional
Estimated Equity
$184,570
Purchase Details
Closed on
Apr 24, 2015
Sold by
Frederick Caren A and Anderson John F
Bought by
Anderson John F
Purchase Details
Closed on
Jan 26, 1966
Bought by
Anderson Barbara
Create a Home Valuation Report for This Property
The Home Valuation Report is an in-depth analysis detailing your home's value as well as a comparison with similar homes in the area
Home Values in the Area
Average Home Value in this Area
Purchase History
| Date | Buyer | Sale Price | Title Company |
|---|---|---|---|
| Barna Edward | $335,580 | Evident Title Agency Inc | |
| Barna Edward | $335,580 | Evident Title Agency | |
| Anderson John F | -- | Attorney | |
| Anderson Barbara | -- | -- |
Source: Public Records
Mortgage History
| Date | Status | Borrower | Loan Amount |
|---|---|---|---|
| Open | Barna Edward | $325,513 | |
| Closed | Barna Edward | $325,513 |
Source: Public Records
Tax History Compared to Growth
Tax History
| Year | Tax Paid | Tax Assessment Tax Assessment Total Assessment is a certain percentage of the fair market value that is determined by local assessors to be the total taxable value of land and additions on the property. | Land | Improvement |
|---|---|---|---|---|
| 2025 | $8,757 | $64,700 | $21,700 | $43,000 |
| 2024 | $8,540 | $64,700 | $21,700 | $43,000 |
| 2023 | $8,540 | $64,700 | $21,700 | $43,000 |
| 2022 | $8,020 | $64,700 | $21,700 | $43,000 |
| 2021 | $7,937 | $64,700 | $21,700 | $43,000 |
| 2020 | $7,261 | $61,200 | $21,700 | $39,500 |
| 2019 | $7,077 | $61,200 | $21,700 | $39,500 |
| 2018 | $6,891 | $61,200 | $21,700 | $39,500 |
| 2017 | $6,752 | $61,200 | $21,700 | $39,500 |
| 2016 | $6,687 | $61,200 | $21,700 | $39,500 |
| 2015 | $6,556 | $61,200 | $21,700 | $39,500 |
| 2014 | $6,400 | $61,200 | $21,700 | $39,500 |
Source: Public Records
Map
Nearby Homes