178 Gulf Rd Peterborough, NH 03458
Peterborough AreaEstimated Value: $568,671 - $673,000
About This Home
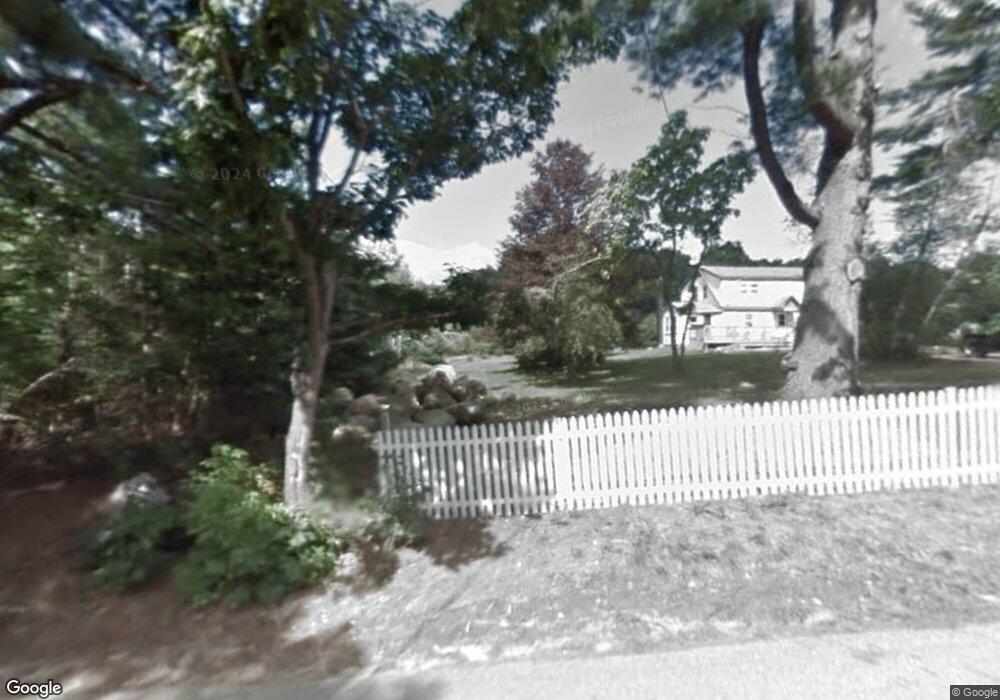
This home is located at 178 Gulf Rd, Peterborough, NH 03458 and is currently estimated at $631,668, approximately $256 per square foot. 178 Gulf Rd is a home with nearby schools including Peterborough Elementary School, South Meadow School, and Conval Regional High School.
Ownership History
We collect this data history from publicly available records. To have your information removed, we recommend requesting removal directly through your county’s website.
Purchase Details
Purchase Details
Home Values in the Area
Average Home Value in this Area
Purchase History
We collect this data history from publicly available records. To have your information removed, we recommend requesting removal directly through your county’s website.
| Date | Buyer | Sale Price | Title Company |
|---|---|---|---|
| -- | -- | ||
| $21,000 | -- |
Mortgage History
We collect this data history from publicly available records. To have your information removed, we recommend requesting removal directly through your county’s website.
| Date | Status | Borrower | Loan Amount |
|---|---|---|---|
| Open | $75,000 | ||
| Closed | $160,000 | ||
| Previous Owner | $215,976 | ||
| Closed | $100,000 | ||
| Closed | $60,000 | ||
| Previous Owner | $138,217 |
Tax History
We collect this data history from publicly available records. To have your information removed, we recommend requesting removal directly through your county’s website.
| Year | Tax Paid | Tax Assessment Tax Assessment Total Assessment is a certain percentage of the fair market value that is determined by local assessors to be the total taxable value of land and additions on the property. | Land | Improvement |
|---|---|---|---|---|
| 2025 | $11,642 | $358,200 | $51,000 | $307,200 |
| 2024 | $11,642 | $358,200 | $51,000 | $307,200 |
| 2023 | $10,098 | $358,200 | $51,000 | $307,200 |
| 2022 | $9,263 | $358,200 | $51,000 | $307,200 |
| 2021 | $9,227 | $358,200 | $51,000 | $307,200 |
| 2020 | $9,289 | $301,200 | $40,000 | $261,200 |
| 2019 | $8,961 | $301,200 | $40,000 | $261,200 |
| 2018 | $9,138 | $303,700 | $42,500 | $261,200 |
| 2017 | $7,318 | $232,600 | $42,300 | $190,300 |
| 2016 | $7,093 | $230,000 | $42,300 | $187,700 |
| 2015 | $6,833 | $230,000 | $42,300 | $187,700 |
| 2014 | $6,595 | $215,800 | $44,900 | $170,900 |
Map
- 215 General Miller Rd
- 491 Greenfield Rd
- 489 Greenfield Rd
- 230 Old Greenfield Rd
- 21 Burke Rd
- 238 Slip Rd
- 62 Monadnock Ln
- 201 Slip Rd
- 34 Ice House Ln
- 108 Old Bennington Rd
- 105 Southfield Ln
- 408 Southfield Ln
- 16 Currier Ave
- 7 Picard Rd
- 68 Gulf Rd
- 0 East Rd Unit 6
- 186 Old Bennington Rd
- 23 Lucy Ln
- 11 Lucy Ln
- 9 Lucy Ln
Ask me questions while you tour the home.