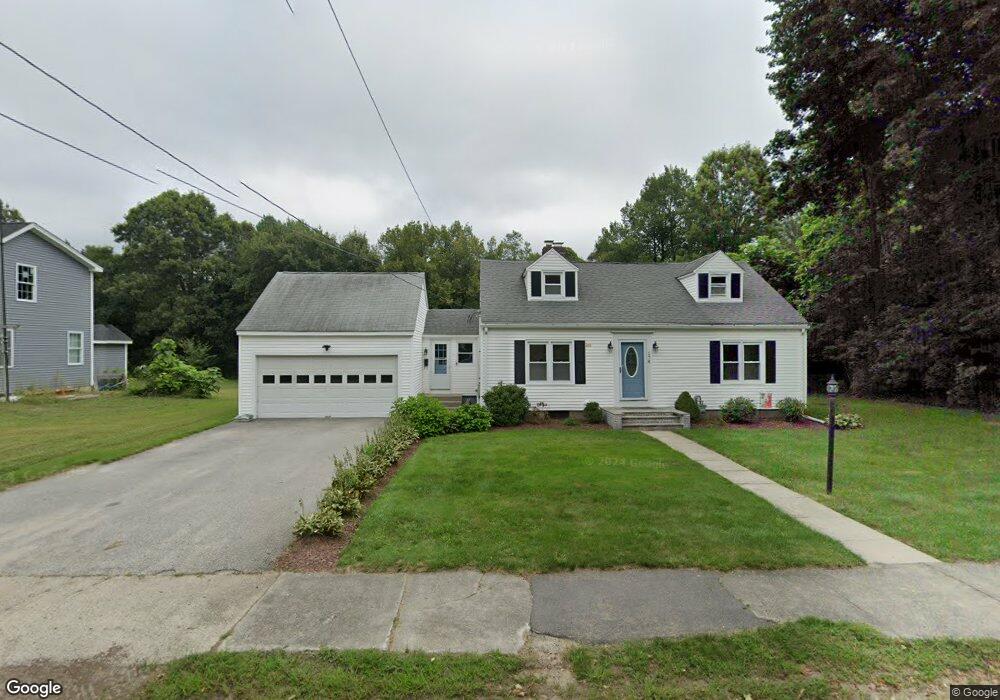
178 Hecla St Uxbridge, MA 01569
Estimated Value: $518,127 - $558,000
4
Beds
2
Baths
1,748
Sq Ft
$307/Sq Ft
Est. Value
About This Home
This home is located at 178 Hecla St, Uxbridge, MA 01569 and is currently estimated at $536,282, approximately $306 per square foot. 178 Hecla St is a home located in Worcester County with nearby schools including Uxbridge High School and Our Lady of the Valley Regional School.
Ownership History
Date
Name
Owned For
Owner Type
Purchase Details
Closed on
Dec 18, 2008
Sold by
Rice Mary T and Rice Peter E
Bought by
Caffrey Jennifer
Current Estimated Value
Home Financials for this Owner
Home Financials are based on the most recent Mortgage that was taken out on this home.
Original Mortgage
$185,250
Outstanding Balance
$123,238
Interest Rate
6.27%
Mortgage Type
Purchase Money Mortgage
Estimated Equity
$413,044
Create a Home Valuation Report for This Property
The Home Valuation Report is an in-depth analysis detailing your home's value as well as a comparison with similar homes in the area
Home Values in the Area
Average Home Value in this Area
Purchase History
| Date | Buyer | Sale Price | Title Company |
|---|---|---|---|
| Caffrey Jennifer | $195,000 | -- |
Source: Public Records
Mortgage History
| Date | Status | Borrower | Loan Amount |
|---|---|---|---|
| Open | Caffrey Jennifer | $185,250 |
Source: Public Records
Tax History Compared to Growth
Tax History
| Year | Tax Paid | Tax Assessment Tax Assessment Total Assessment is a certain percentage of the fair market value that is determined by local assessors to be the total taxable value of land and additions on the property. | Land | Improvement |
|---|---|---|---|---|
| 2025 | $53 | $400,700 | $134,400 | $266,300 |
| 2024 | $4,872 | $377,100 | $123,200 | $253,900 |
| 2023 | $4,696 | $336,600 | $112,000 | $224,600 |
| 2022 | $4,498 | $296,700 | $101,500 | $195,200 |
| 2021 | $4,506 | $284,800 | $97,100 | $187,700 |
| 2020 | $4,542 | $271,300 | $99,900 | $171,400 |
| 2019 | $4,410 | $254,200 | $92,500 | $161,700 |
| 2018 | $4,062 | $236,600 | $92,500 | $144,100 |
| 2017 | $3,906 | $230,300 | $86,400 | $143,900 |
| 2016 | $3,813 | $217,000 | $84,800 | $132,200 |
| 2015 | $3,734 | $214,600 | $84,800 | $129,800 |
Source: Public Records
Map
Nearby Homes
- 14 Brown Terrace
- 286 Blackstone St
- 37 Elizabeth St
- 256 Mendon St
- 69 Pouts Ln
- 46 Pouts Ln Unit 46
- 24 Road Ahr
- 85 East St
- 436 Blackstone St
- 328 Millville Rd
- 16 Pleasant St
- 346 Millville Rd
- 46 Capron St
- 45 Nature View Dr
- 10 Old Millville Rd
- 3 Highness Dr Unit 3
- 13A Asylum St
- The Contemporary Villager Plan at Patriot's Landing
- Karenrose Sunnery Plan at Patriot's Landing
- 19 Snowling Rd