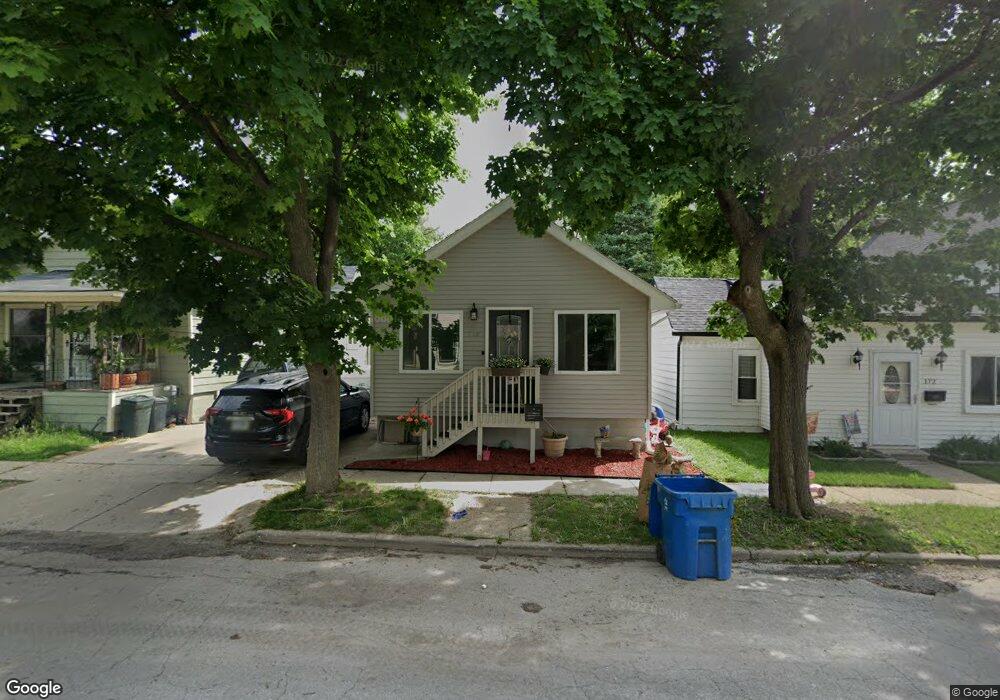
178 Higgins St Unit Bldg-Unit Lapeer, MI 48446
Estimated Value: $173,000 - $204,000
3
Beds
1
Bath
966
Sq Ft
$191/Sq Ft
Est. Value
About This Home
This home is located at 178 Higgins St Unit Bldg-Unit, Lapeer, MI 48446 and is currently estimated at $184,085, approximately $190 per square foot. 178 Higgins St Unit Bldg-Unit is a home located in Lapeer County with nearby schools including C.K. Schickler Elementary School, Rolland-Warner Middle School, and Lapeer High School.
Ownership History
Date
Name
Owned For
Owner Type
Purchase Details
Closed on
Sep 4, 2019
Sold by
Gwendolyn Jankowsky Revocable Living Tru
Bought by
Marks Glen and Marks James Amanda
Current Estimated Value
Home Financials for this Owner
Home Financials are based on the most recent Mortgage that was taken out on this home.
Original Mortgage
$129,010
Outstanding Balance
$113,234
Interest Rate
3.7%
Mortgage Type
New Conventional
Estimated Equity
$70,851
Purchase Details
Closed on
Jun 19, 2018
Sold by
Hovey and Tamra
Bought by
Gwendolyn Jankowsky Revocable
Purchase Details
Closed on
Jun 15, 2018
Sold by
Hovey Steven and Hovey Tamra
Bought by
Jankowsky Gwendolyn
Purchase Details
Closed on
May 26, 1996
Sold by
Hovey Steven and Hovey Tamra
Bought by
Trandell
Purchase Details
Closed on
Nov 1, 1995
Sold by
Zorn Kenneth M and Zorn Janet R
Bought by
Hovey Steven and Hovey Tamra
Purchase Details
Closed on
Dec 17, 1992
Create a Home Valuation Report for This Property
The Home Valuation Report is an in-depth analysis detailing your home's value as well as a comparison with similar homes in the area
Home Values in the Area
Average Home Value in this Area
Purchase History
| Date | Buyer | Sale Price | Title Company |
|---|---|---|---|
| Marks Glen | $133,000 | Cislo Title | |
| Gwendolyn Jankowsky Revocable | $55,000 | Cislo Title | |
| Jankowsky Gwendolyn | $55,000 | -- | |
| Gwendolyn Jankowsky Revocable | $55,000 | Cislo Title | |
| Trandell | $2,500 | -- | |
| Hovey Steven | $41,800 | -- | |
| -- | $33,500 | -- |
Source: Public Records
Mortgage History
| Date | Status | Borrower | Loan Amount |
|---|---|---|---|
| Open | Marks Glen | $129,010 | |
| Closed | Marks Glen | $5,742 |
Source: Public Records
Tax History Compared to Growth
Tax History
| Year | Tax Paid | Tax Assessment Tax Assessment Total Assessment is a certain percentage of the fair market value that is determined by local assessors to be the total taxable value of land and additions on the property. | Land | Improvement |
|---|---|---|---|---|
| 2025 | $1,362 | $66,400 | $0 | $0 |
| 2024 | $907 | $63,200 | $0 | $0 |
| 2023 | $865 | $59,100 | $0 | $0 |
| 2022 | $1,232 | $60,700 | $0 | $0 |
| 2021 | $1,142 | $54,600 | $0 | $0 |
| 2020 | $1,115 | $39,600 | $0 | $0 |
| 2019 | $1,049 | $36,200 | $0 | $0 |
| 2018 | $667 | $31,800 | $31,800 | $0 |
| 2017 | $655 | $31,000 | $0 | $0 |
| 2016 | $442 | $26,700 | $26,700 | $0 |
| 2015 | -- | $0 | $0 | $0 |
| 2014 | -- | $22,600 | $22,600 | $0 |
| 2013 | -- | $21,600 | $21,600 | $0 |
Source: Public Records
Map
Nearby Homes
- 215 Mason St
- 339 N Main St
- 116 W Genesee St
- 47 Pope St
- 745 N Calhoun St
- 1111 W Park St
- 706 N Main St
- 323 Turrill Ave
- 37 S Jackson St
- 1331 W Genesee St
- 1340 W Genesee St
- 847 N Main St
- 835 N Main St
- 1120 W Oregon St
- 1533 Pleasant St
- 1615 W Genesee St
- 350 N Jackson St
- 33 Union St
- 552 Turn Bull St
- 0000 Imlay City Rd