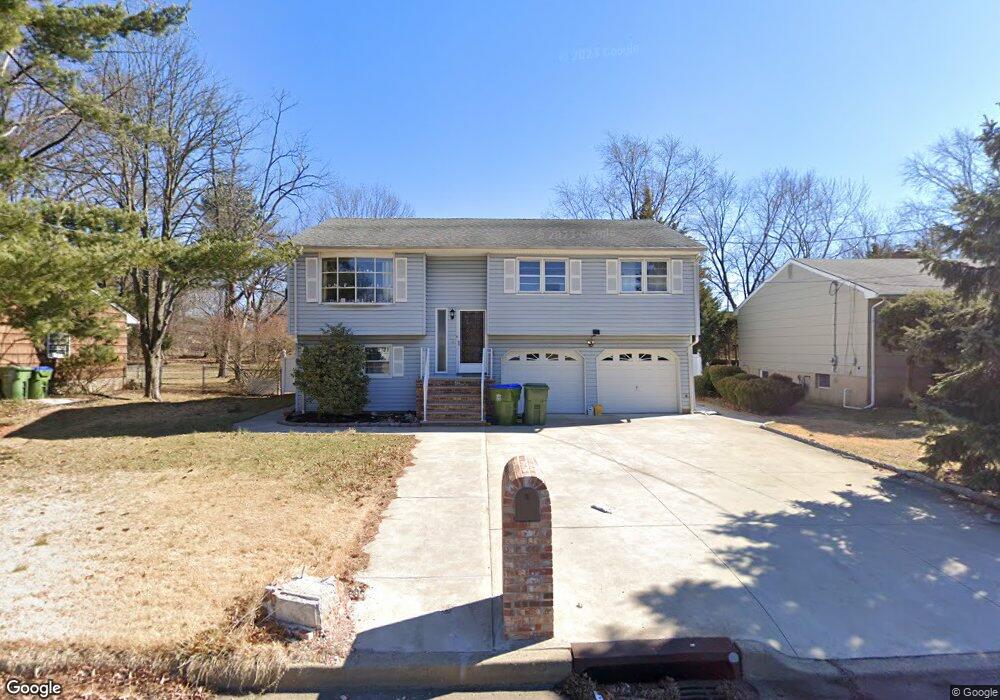
178 Jeff St Edison, NJ 08837
Estimated Value: $565,000 - $699,000
4
Beds
2
Baths
1,246
Sq Ft
$493/Sq Ft
Est. Value
About This Home
This home is located at 178 Jeff St, Edison, NJ 08837 and is currently estimated at $614,752, approximately $493 per square foot. 178 Jeff St is a home located in Middlesex County with nearby schools including Lincoln Elementary School, Herbert Hoover Middle School, and Edison High School.
Ownership History
Date
Name
Owned For
Owner Type
Purchase Details
Closed on
Aug 30, 2010
Sold by
Kallos Roza
Bought by
Rodriguez Roberto and Rodriguez Rocio
Current Estimated Value
Home Financials for this Owner
Home Financials are based on the most recent Mortgage that was taken out on this home.
Original Mortgage
$231,000
Outstanding Balance
$153,386
Interest Rate
4.55%
Mortgage Type
New Conventional
Estimated Equity
$461,366
Purchase Details
Closed on
Dec 18, 2009
Sold by
Kallos Roza
Bought by
Kallos Roza
Create a Home Valuation Report for This Property
The Home Valuation Report is an in-depth analysis detailing your home's value as well as a comparison with similar homes in the area
Home Values in the Area
Average Home Value in this Area
Purchase History
| Date | Buyer | Sale Price | Title Company |
|---|---|---|---|
| Rodriguez Roberto | $330,000 | None Available | |
| Kallos Roza | -- | None Available |
Source: Public Records
Mortgage History
| Date | Status | Borrower | Loan Amount |
|---|---|---|---|
| Open | Rodriguez Roberto | $231,000 |
Source: Public Records
Tax History
| Year | Tax Paid | Tax Assessment Tax Assessment Total Assessment is a certain percentage of the fair market value that is determined by local assessors to be the total taxable value of land and additions on the property. | Land | Improvement |
|---|---|---|---|---|
| 2025 | $9,507 | $159,700 | $81,200 | $78,500 |
| 2024 | $9,456 | $159,700 | $81,200 | $78,500 |
Source: Public Records
Map
Nearby Homes
- 26 Goodwill Place
- 95 E Walnut St
- 2 Goodwill Place
- 15 Mccoy Ave
- 174 Alcoa Ave
- 72 Kempson Place
- 35 Orchard St
- 84 Heman St
- 12 Juniper St
- 55 Grove Ave
- 18A Garfield Park
- 18 Garfield Park Unit A
- 12 Garfield Park Unit A
- 1 U S Route 1
- 56 Homer Place
- 162 Brower Ave
- 28 Plymouth Place
- 99 Liddle Ave Unit B10
- 105 Howard Ave
- 212 Echo Ave
Your Personal Tour Guide
Ask me questions while you tour the home.