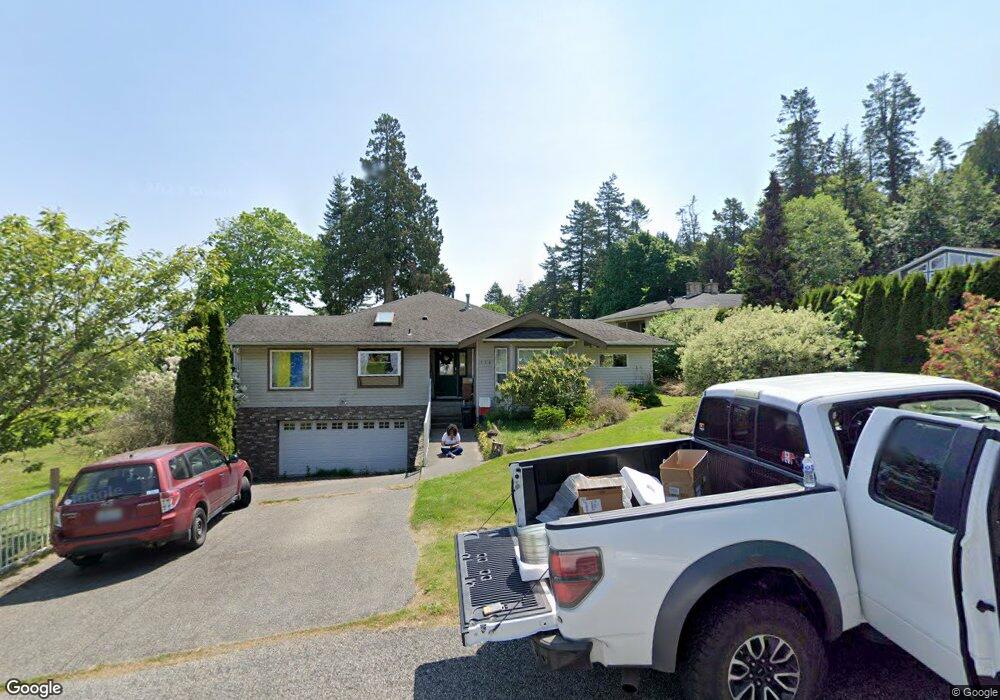
178 Kilarney Place Point Roberts, WA 98281
Estimated Value: $671,009 - $785,000
3
Beds
3
Baths
1,975
Sq Ft
$365/Sq Ft
Est. Value
About This Home
This home is located at 178 Kilarney Place, Point Roberts, WA 98281 and is currently estimated at $721,502, approximately $365 per square foot. 178 Kilarney Place is a home located in Whatcom County with nearby schools including Point Roberts Primary School, Blaine Middle School, and Blaine High School.
Ownership History
Date
Name
Owned For
Owner Type
Purchase Details
Closed on
Nov 19, 2010
Sold by
Mcclusky Linda H
Bought by
Mcclusky Campbell S
Current Estimated Value
Purchase Details
Closed on
Jul 31, 2004
Sold by
Mcclusky Campbell S and Mcclusky Linda H
Bought by
Mcclusky Campbell S and Mcclusky Linda H
Purchase Details
Closed on
Jun 14, 2002
Sold by
Hewson Kenneth G and Hewson Kelly G
Bought by
Mcclusky Campbell S and Mcclusky Linda H
Home Financials for this Owner
Home Financials are based on the most recent Mortgage that was taken out on this home.
Original Mortgage
$216,000
Interest Rate
6.74%
Create a Home Valuation Report for This Property
The Home Valuation Report is an in-depth analysis detailing your home's value as well as a comparison with similar homes in the area
Home Values in the Area
Average Home Value in this Area
Purchase History
| Date | Buyer | Sale Price | Title Company |
|---|---|---|---|
| Mcclusky Campbell S | -- | None Available | |
| Mcclusky Campbell S | -- | -- | |
| Mcclusky Campbell S | -- | Chicago Title Insurance |
Source: Public Records
Mortgage History
| Date | Status | Borrower | Loan Amount |
|---|---|---|---|
| Previous Owner | Mcclusky Campbell S | $216,000 |
Source: Public Records
Tax History Compared to Growth
Tax History
| Year | Tax Paid | Tax Assessment Tax Assessment Total Assessment is a certain percentage of the fair market value that is determined by local assessors to be the total taxable value of land and additions on the property. | Land | Improvement |
|---|---|---|---|---|
| 2024 | $5,175 | $667,283 | $192,720 | $474,563 |
| 2023 | $5,175 | $649,763 | $175,200 | $474,563 |
| 2022 | $4,520 | $593,391 | $160,000 | $433,391 |
| 2021 | $4,501 | $469,013 | $133,760 | $335,253 |
| 2020 | $4,474 | $434,265 | $123,850 | $310,415 |
| 2019 | $4,137 | $416,558 | $118,800 | $297,758 |
| 2018 | $4,106 | $374,481 | $106,800 | $267,681 |
| 2017 | $3,558 | $357,651 | $102,000 | $255,651 |
| 2016 | $3,592 | $350,638 | $100,000 | $250,638 |
| 2015 | $3,820 | $344,120 | $96,610 | $247,510 |
| 2014 | -- | $359,750 | $101,000 | $258,750 |
| 2013 | -- | $343,919 | $97,000 | $246,919 |
Source: Public Records
Map
Nearby Homes
- 103 Goodman Rd
- 2145 Fir St
- 251 Elizabeth Dr
- 0 3 73 Acres Derby Ave
- 2138 Benson Rd
- 302 Boundary Bay Rd
- 4 Boundary Bay Rd
- Lot 35 Boundary Bay Rd
- 0 X Weasel Run
- 1931 Sanders Ct Unit 11
- 412 High Bluff Dr
- 0 Lot 7 Weasel Run Rd
- 6 Weasel Run Rd
- 1871 Johnson Rd
- 500 Moose Trail
- Lot 2 Greenwood Dr
- lot 14 Cedar Park Dr Unit 14
- 1976 Cedar Park Dr
- 1 Mill Rd
- 2 Mill Rd
- 184 Kilarney Place
- Lot 37 Wicklow Place
- Lots 34 & 35 Wicklow Place
- 2149 Wicklow Place
- 0 Kilarney Place
- 0 Lot 13 Kilarney Place
- 2177 Wicklow Place
- 2170 Wicklow Place
- 2164 Wicklow Place
- 190 Kilarney Place
- 177 Kilarney Place
- 2174 Wicklow Place
- 2158 Wicklow Place
- 119 Kilarney Place
- 2180 Wicklow Place
- 2189 Wicklow Place
- 2190 Wicklow Place
- 2135 Wicklow Place
- 188 Donegal Dr