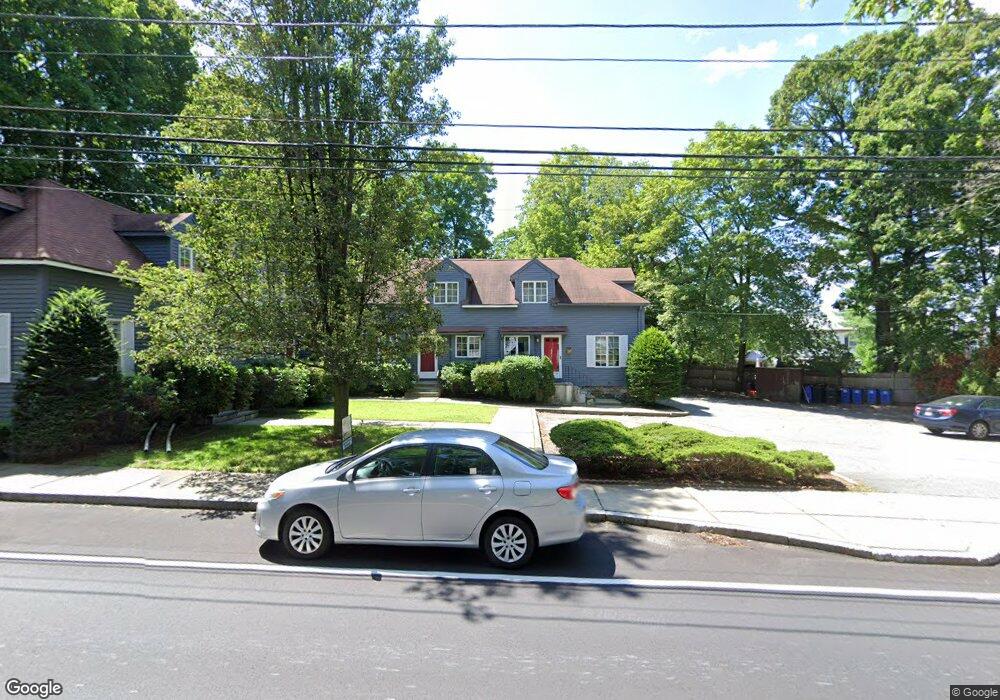
178 Lowell St Unit 5 Reading, MA 01867
Estimated Value: $506,000 - $568,000
2
Beds
2
Baths
1,172
Sq Ft
$458/Sq Ft
Est. Value
About This Home
This home is located at 178 Lowell St Unit 5, Reading, MA 01867 and is currently estimated at $536,735, approximately $457 per square foot. 178 Lowell St Unit 5 is a home located in Middlesex County with nearby schools including Birch Meadow Elementary School, Walter S. Parker Middle School, and Reading Memorial High School.
Ownership History
Date
Name
Owned For
Owner Type
Purchase Details
Closed on
Mar 5, 2007
Bought by
Mabary Lisa T and Mabary Richard K
Current Estimated Value
Home Financials for this Owner
Home Financials are based on the most recent Mortgage that was taken out on this home.
Original Mortgage
$30,000
Interest Rate
6.27%
Mortgage Type
Purchase Money Mortgage
Purchase Details
Closed on
Jul 29, 1999
Sold by
Schnare Lynda J
Bought by
Thomas Alison G
Purchase Details
Closed on
Apr 16, 1993
Sold by
Harris Karen L
Bought by
Schnare Lynda J
Purchase Details
Closed on
Jun 21, 1989
Sold by
Hayes George F
Bought by
Altobelli Karen
Purchase Details
Closed on
Feb 2, 1988
Sold by
178 Lowell St Tr
Bought by
Hayes George F
Create a Home Valuation Report for This Property
The Home Valuation Report is an in-depth analysis detailing your home's value as well as a comparison with similar homes in the area
Home Values in the Area
Average Home Value in this Area
Purchase History
| Date | Buyer | Sale Price | Title Company |
|---|---|---|---|
| Mabary Lisa T | -- | -- | |
| Thomas Alison G | $172,000 | -- | |
| Schnare Lynda J | $133,000 | -- | |
| Altobelli Karen | $160,000 | -- | |
| Hayes George F | $155,900 | -- |
Source: Public Records
Mortgage History
| Date | Status | Borrower | Loan Amount |
|---|---|---|---|
| Previous Owner | Hayes George F | $168,400 | |
| Previous Owner | Mabary Lisa T | $30,000 | |
| Previous Owner | Hayes George F | $21,500 | |
| Previous Owner | Hayes George F | $50,000 |
Source: Public Records
Tax History Compared to Growth
Tax History
| Year | Tax Paid | Tax Assessment Tax Assessment Total Assessment is a certain percentage of the fair market value that is determined by local assessors to be the total taxable value of land and additions on the property. | Land | Improvement |
|---|---|---|---|---|
| 2025 | $5,079 | $445,900 | $0 | $445,900 |
| 2024 | $3,786 | $323,000 | $0 | $323,000 |
| 2023 | $3,883 | $308,400 | $0 | $308,400 |
| 2022 | $3,888 | $291,700 | $0 | $291,700 |
| 2021 | $3,885 | $281,300 | $0 | $281,300 |
| 2020 | $3,838 | $275,100 | $0 | $275,100 |
| 2019 | $3,915 | $275,100 | $0 | $275,100 |
| 2018 | $3,699 | $266,700 | $0 | $266,700 |
| 2017 | $3,566 | $254,200 | $0 | $254,200 |
| 2016 | $3,612 | $249,100 | $0 | $249,100 |
| 2015 | $3,538 | $240,700 | $0 | $240,700 |
| 2014 | $3,461 | $234,800 | $0 | $234,800 |
Source: Public Records
Map
Nearby Homes
- 195 Lowell St
- 42 Winthrop Ave
- 77 Mount Vernon St
- 103 High St
- 16 Glen Rd
- 5 Washington St Unit B2
- 52 Sanborn St Unit 408
- 856 Main St
- 863 Main St
- 1 Charles St Unit N
- 101 King St Unit 101
- 52 Salem St
- 266 West St
- 33 Marla Ln
- 25 Martin Rd
- 28 Martin Rd
- 48 Village St Unit 1001
- 35 Park Ave
- 444 Lowell St
- 24 Minot St
- 178 Lowell St Unit 4
- 178 Lowell St Unit 3
- 178 Lowell St Unit 2
- 178 Lowell St Unit 1
- 178 Lowell St Unit 5/3
- 174 Lowell St
- 186 Lowell St
- 83 Grand St
- 175 Lowell St
- 79 Grand St
- 179 Lowell St
- 173 Lowell St
- 181 Lowell St
- 11 Harriman Ave
- 168 Lowell St
- 169 Lowell St
- 85 Grand St
- 17 Harriman Ave
- 167 Lowell St
- 89 Grand St