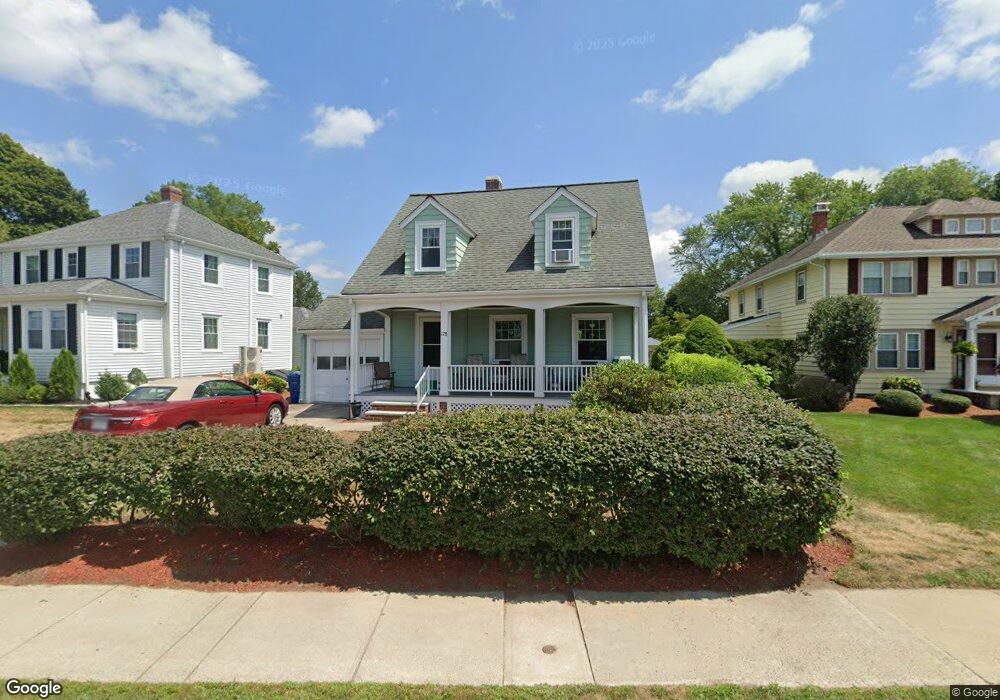
178 Main St Wakefield, MA 01880
Lakeside NeighborhoodEstimated Value: $781,669 - $926,000
3
Beds
1
Bath
1,339
Sq Ft
$616/Sq Ft
Est. Value
About This Home
This home is located at 178 Main St, Wakefield, MA 01880 and is currently estimated at $824,417, approximately $615 per square foot. 178 Main St is a home located in Middlesex County with nearby schools including Wakefield Memorial High School, St Joseph School, and Odyssey Day School.
Ownership History
Date
Name
Owned For
Owner Type
Purchase Details
Closed on
Mar 8, 2010
Sold by
Franson Barbara W
Bought by
Bwf Rt
Current Estimated Value
Purchase Details
Closed on
Dec 20, 2004
Sold by
Kelleher John J
Bought by
Franson Barbara W
Home Financials for this Owner
Home Financials are based on the most recent Mortgage that was taken out on this home.
Original Mortgage
$500,000
Interest Rate
5.68%
Mortgage Type
Purchase Money Mortgage
Create a Home Valuation Report for This Property
The Home Valuation Report is an in-depth analysis detailing your home's value as well as a comparison with similar homes in the area
Home Values in the Area
Average Home Value in this Area
Purchase History
| Date | Buyer | Sale Price | Title Company |
|---|---|---|---|
| Bwf Rt | -- | -- | |
| Franson Barbara W | $500,000 | -- |
Source: Public Records
Mortgage History
| Date | Status | Borrower | Loan Amount |
|---|---|---|---|
| Previous Owner | Franson Barbara W | $500,000 |
Source: Public Records
Tax History Compared to Growth
Tax History
| Year | Tax Paid | Tax Assessment Tax Assessment Total Assessment is a certain percentage of the fair market value that is determined by local assessors to be the total taxable value of land and additions on the property. | Land | Improvement |
|---|---|---|---|---|
| 2025 | $7,994 | $704,300 | $386,100 | $318,200 |
| 2024 | $7,545 | $670,700 | $367,700 | $303,000 |
| 2023 | $7,343 | $626,000 | $343,200 | $282,800 |
| 2022 | $6,886 | $558,900 | $306,400 | $252,500 |
| 2021 | $6,483 | $509,300 | $286,500 | $222,800 |
| 2020 | $6,122 | $479,400 | $269,700 | $209,700 |
| 2019 | $5,930 | $462,200 | $260,000 | $202,200 |
| 2018 | $5,708 | $440,800 | $248,000 | $192,800 |
| 2017 | $5,577 | $428,000 | $240,800 | $187,200 |
| 2016 | $5,213 | $386,400 | $223,300 | $163,100 |
| 2015 | $5,106 | $378,800 | $218,900 | $159,900 |
| 2014 | $4,841 | $378,800 | $218,900 | $159,900 |
Source: Public Records
Map
Nearby Homes
- 29 Cordis St
- 270 Lowell St
- 22 Wayland Rd
- 50 Quannapowitt Pkwy
- 16 Pleasant St
- 395 Vernon St
- 6 Avon Ct Unit 2
- 51 Crescent St
- 34 Cedar St
- 95 Prospect St
- 40 Friend St
- 62 Foundry St Unit 310
- 62 Foundry St Unit 312
- 62 Foundry St Unit 412
- 62 Foundry St Unit 204
- 62 Foundry St Unit 309
- 62 Foundry St Unit 202
- 62 Foundry St Unit 208
- 62 Foundry St Unit 414
- 69 Foundry St Unit 310