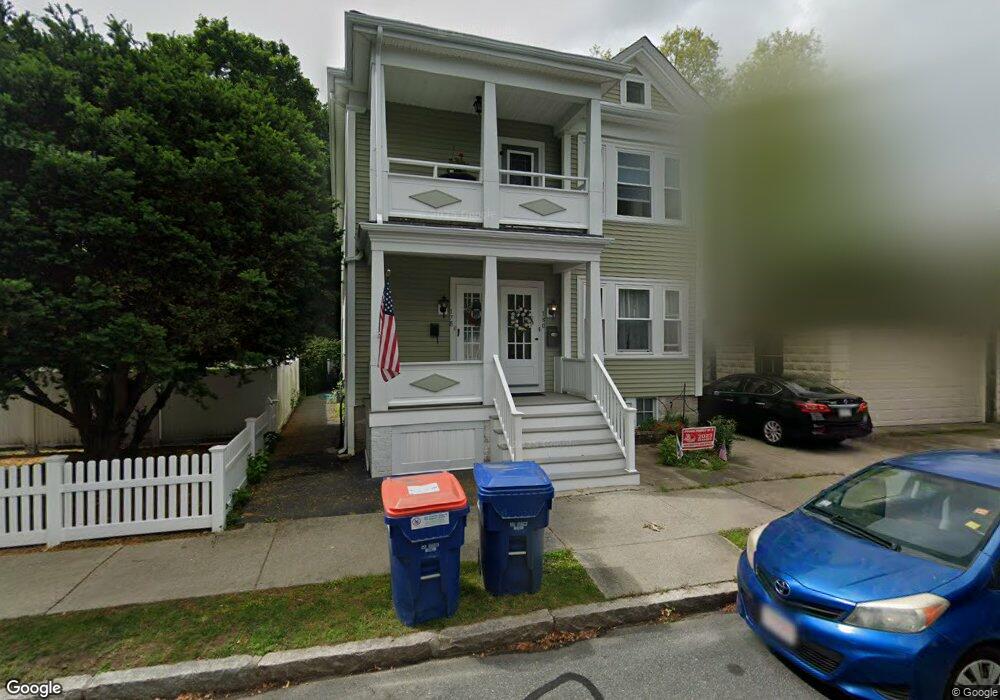
178 Maple St New Bedford, MA 02740
Downtown New Bedford NeighborhoodEstimated Value: $498,205 - $582,000
6
Beds
2
Baths
2,630
Sq Ft
$211/Sq Ft
Est. Value
About This Home
This home is located at 178 Maple St, New Bedford, MA 02740 and is currently estimated at $556,051, approximately $211 per square foot. 178 Maple St is a home located in Bristol County with nearby schools including Ellen R. Hathaway Elementary School, Keith Middle School, and New Bedford High School.
Ownership History
Date
Name
Owned For
Owner Type
Purchase Details
Closed on
Aug 31, 2010
Sold by
Benjamin Americo F and Benjamin Diane
Bought by
Dubois Elizabeth S
Current Estimated Value
Create a Home Valuation Report for This Property
The Home Valuation Report is an in-depth analysis detailing your home's value as well as a comparison with similar homes in the area
Home Values in the Area
Average Home Value in this Area
Purchase History
| Date | Buyer | Sale Price | Title Company |
|---|---|---|---|
| Dubois Elizabeth S | $257,000 | -- | |
| Dubois Elizabeth S | $257,000 | -- |
Source: Public Records
Mortgage History
| Date | Status | Borrower | Loan Amount |
|---|---|---|---|
| Previous Owner | Dubois Elizabeth S | $150,000 | |
| Previous Owner | Dubois Elizabeth S | $90,000 | |
| Previous Owner | Dubois Elizabeth S | $65,000 |
Source: Public Records
Tax History
| Year | Tax Paid | Tax Assessment Tax Assessment Total Assessment is a certain percentage of the fair market value that is determined by local assessors to be the total taxable value of land and additions on the property. | Land | Improvement |
|---|---|---|---|---|
| 2025 | $5,451 | $482,000 | $97,600 | $384,400 |
| 2024 | $4,861 | $405,100 | $99,300 | $305,800 |
| 2023 | $4,824 | $337,600 | $85,600 | $252,000 |
| 2022 | $4,392 | $282,600 | $81,400 | $201,200 |
| 2021 | $4,406 | $282,600 | $81,400 | $201,200 |
| 2020 | $6,657 | $262,000 | $81,400 | $180,600 |
| 2019 | $4,122 | $250,300 | $81,400 | $168,900 |
| 2018 | $3,856 | $231,900 | $81,400 | $150,500 |
| 2017 | $3,470 | $207,900 | $81,400 | $126,500 |
| 2016 | $3,334 | $202,200 | $81,400 | $120,800 |
| 2015 | -- | $198,000 | $81,400 | $116,600 |
| 2014 | -- | $211,000 | $76,500 | $134,500 |
Source: Public Records
Map
Nearby Homes
Your Personal Tour Guide
Ask me questions while you tour the home.