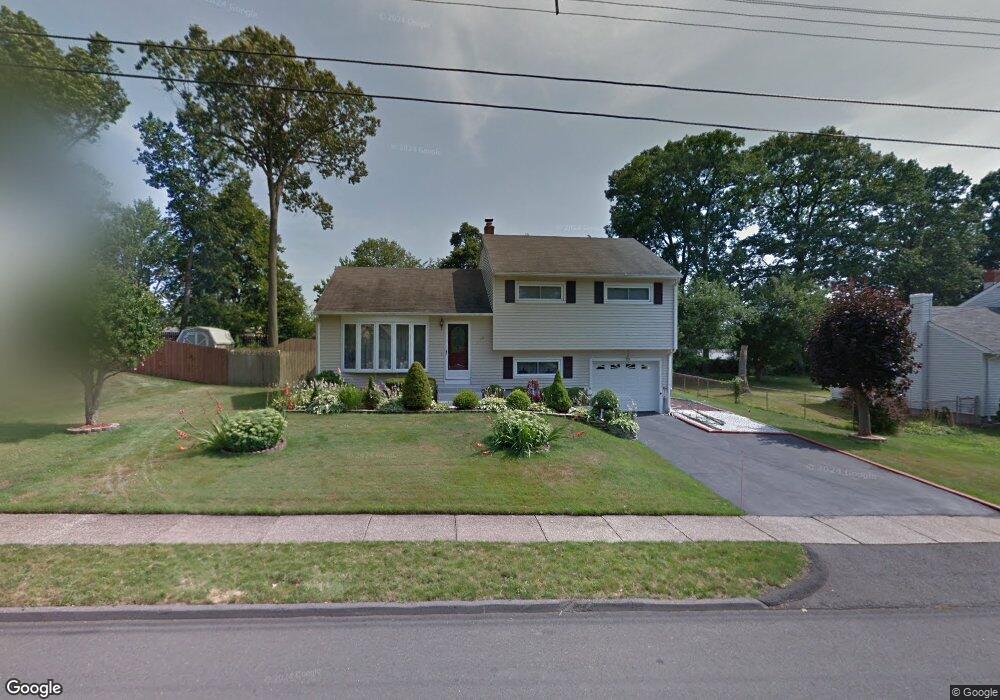
178 Monroe St East Hartford, CT 06118
Estimated Value: $307,955 - $366,000
3
Beds
2
Baths
1,387
Sq Ft
$244/Sq Ft
Est. Value
About This Home
This home is located at 178 Monroe St, East Hartford, CT 06118 and is currently estimated at $338,739, approximately $244 per square foot. 178 Monroe St is a home located in Hartford County with nearby schools including Joseph O. Goodwin School, East Hartford Middle School, and East Hartford High School.
Ownership History
Date
Name
Owned For
Owner Type
Purchase Details
Closed on
Jan 12, 2018
Sold by
Moura Manuel and Moura Normina
Bought by
M N Moura Irt
Current Estimated Value
Purchase Details
Closed on
Jun 5, 2001
Sold by
Aux Michael and Aux Josephine Lisa
Bought by
Moura Manuel R and Moura Normina F
Home Financials for this Owner
Home Financials are based on the most recent Mortgage that was taken out on this home.
Original Mortgage
$75,000
Interest Rate
7.09%
Purchase Details
Closed on
May 28, 1997
Sold by
Schaefer Robert P
Bought by
Aux Michael and Saladine Josephine L
Home Financials for this Owner
Home Financials are based on the most recent Mortgage that was taken out on this home.
Original Mortgage
$115,400
Interest Rate
8.09%
Mortgage Type
Unknown
Create a Home Valuation Report for This Property
The Home Valuation Report is an in-depth analysis detailing your home's value as well as a comparison with similar homes in the area
Home Values in the Area
Average Home Value in this Area
Purchase History
| Date | Buyer | Sale Price | Title Company |
|---|---|---|---|
| M N Moura Irt | -- | -- | |
| Moura Manuel R | $156,500 | -- | |
| Aux Michael | $115,900 | -- |
Source: Public Records
Mortgage History
| Date | Status | Borrower | Loan Amount |
|---|---|---|---|
| Previous Owner | Aux Michael | $75,000 | |
| Previous Owner | Aux Michael | $115,400 | |
| Closed | Aux Michael | $3,000 |
Source: Public Records
Tax History Compared to Growth
Tax History
| Year | Tax Paid | Tax Assessment Tax Assessment Total Assessment is a certain percentage of the fair market value that is determined by local assessors to be the total taxable value of land and additions on the property. | Land | Improvement |
|---|---|---|---|---|
| 2025 | $6,802 | $148,190 | $46,190 | $102,000 |
| 2024 | $6,520 | $148,190 | $46,190 | $102,000 |
| 2023 | $6,304 | $148,190 | $46,190 | $102,000 |
| 2022 | $6,076 | $148,190 | $46,190 | $102,000 |
| 2021 | $5,419 | $109,810 | $35,000 | $74,810 |
| 2020 | $5,482 | $109,810 | $35,000 | $74,810 |
| 2019 | $5,393 | $109,810 | $35,000 | $74,810 |
| 2018 | $5,234 | $109,810 | $35,000 | $74,810 |
| 2017 | $5,167 | $109,810 | $35,000 | $74,810 |
| 2016 | $4,991 | $108,830 | $33,330 | $75,500 |
| 2015 | $4,991 | $108,830 | $33,330 | $75,500 |
| 2014 | $4,941 | $108,830 | $33,330 | $75,500 |
Source: Public Records
Map
Nearby Homes