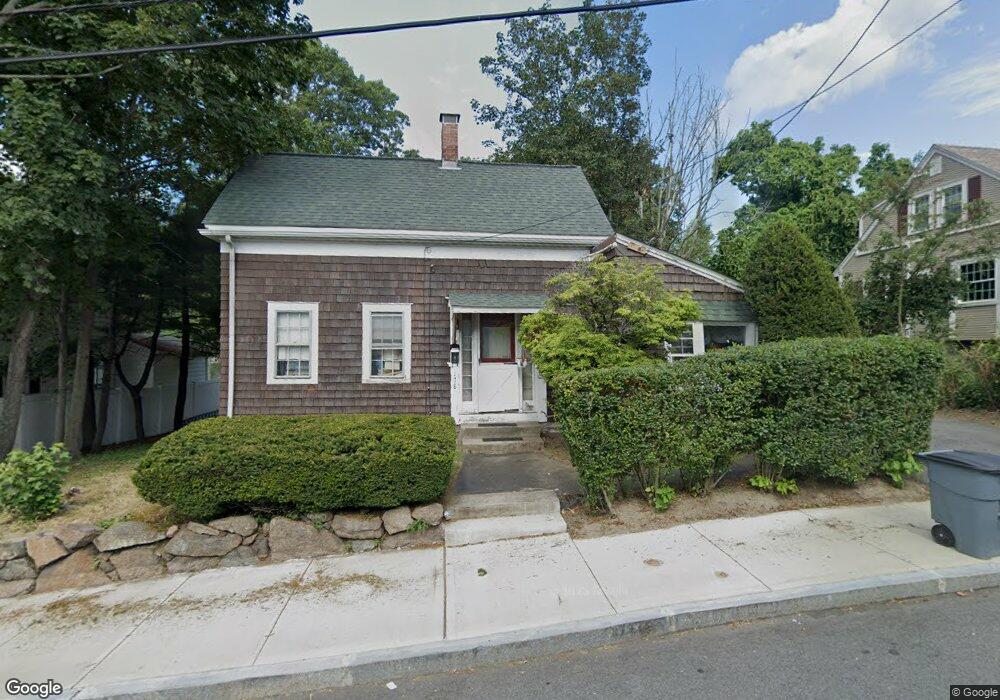
178 Phipps St Quincy, MA 02169
South Quincy NeighborhoodEstimated Value: $538,915 - $623,000
2
Beds
1
Bath
972
Sq Ft
$596/Sq Ft
Est. Value
About This Home
This home is located at 178 Phipps St, Quincy, MA 02169 and is currently estimated at $578,979, approximately $595 per square foot. 178 Phipps St is a home located in Norfolk County with nearby schools including Lincoln-Hancock Community School, South West Middle School, and Quincy High School.
Ownership History
Date
Name
Owned For
Owner Type
Purchase Details
Closed on
Feb 11, 2025
Sold by
Muller Mohan T and Muller Mohan
Bought by
R A Muller Asset Protecti and Muller
Current Estimated Value
Purchase Details
Closed on
Aug 9, 2018
Sold by
Muller Ruth A
Bought by
Muller Mohan T
Purchase Details
Closed on
Aug 4, 1986
Bought by
Muller Ruth Anne
Create a Home Valuation Report for This Property
The Home Valuation Report is an in-depth analysis detailing your home's value as well as a comparison with similar homes in the area
Home Values in the Area
Average Home Value in this Area
Purchase History
| Date | Buyer | Sale Price | Title Company |
|---|---|---|---|
| R A Muller Asset Protecti | -- | None Available | |
| Muller Mohan T | -- | -- | |
| Muller Ruth Anne | $120,800 | -- |
Source: Public Records
Mortgage History
| Date | Status | Borrower | Loan Amount |
|---|---|---|---|
| Previous Owner | Muller Ruth Anne | $90,000 |
Source: Public Records
Tax History
| Year | Tax Paid | Tax Assessment Tax Assessment Total Assessment is a certain percentage of the fair market value that is determined by local assessors to be the total taxable value of land and additions on the property. | Land | Improvement |
|---|---|---|---|---|
| 2025 | $5,635 | $488,700 | $312,200 | $176,500 |
| 2024 | $5,265 | $467,200 | $297,400 | $169,800 |
| 2023 | $4,679 | $420,400 | $270,600 | $149,800 |
| 2022 | $4,409 | $368,000 | $225,800 | $142,200 |
| 2021 | $4,271 | $351,800 | $225,800 | $126,000 |
| 2020 | $4,230 | $340,300 | $225,800 | $114,500 |
| 2019 | $4,090 | $325,900 | $213,200 | $112,700 |
| 2018 | $3,929 | $294,500 | $197,600 | $96,900 |
| 2017 | $3,938 | $277,900 | $188,200 | $89,700 |
| 2016 | $3,574 | $248,900 | $164,000 | $84,900 |
| 2015 | $3,526 | $241,500 | $164,000 | $77,500 |
| 2014 | $3,485 | $234,500 | $164,000 | $70,500 |
Source: Public Records
Map
Nearby Homes
- 166 Phipps St
- 155 Kendrick Ave Unit 502
- 50 N Payne St Unit 1
- 50 N Payne St Unit 4
- 50 N Payne St Unit 6
- 177 Franklin St
- 126 Water St
- 87 Franklin St Unit 105
- 36 Independence Ave Unit 1
- 8 Jackson St Unit B4
- 33 Elm St
- 192 Federal Ave Unit B
- 28 Brook Rd
- 18 Cliveden St Unit 406W
- 2 Cliveden St Unit 601E
- 2 Cliveden St Unit 405E
- 35 Miller Stile Rd
- 5 Main St
- 51 Sumner St
- 200 Falls Blvd Unit B305
- 182 Phipps St
- 186 Phipps St
- 186 Phipps St Unit 1
- 177 Phipps St
- 177 Phipps St Unit B
- 177 Phipps St Unit 2
- 18 Mortimer Terrace
- 171 Phipps St
- 109 Faxon Park Rd
- 115 Faxon Park Rd
- 183 Phipps St
- 165 Phipps St
- 101 Faxon Park Rd
- 105 Faxon Park Rd
- 127 Faxon Park Dr Unit 4
- 127 Faxon Park Dr Unit 3
- 158 Phipps St
- 158 Phipps St Unit 158
- 187 Phipps St
- 189 Phipps St
Your Personal Tour Guide
Ask me questions while you tour the home.