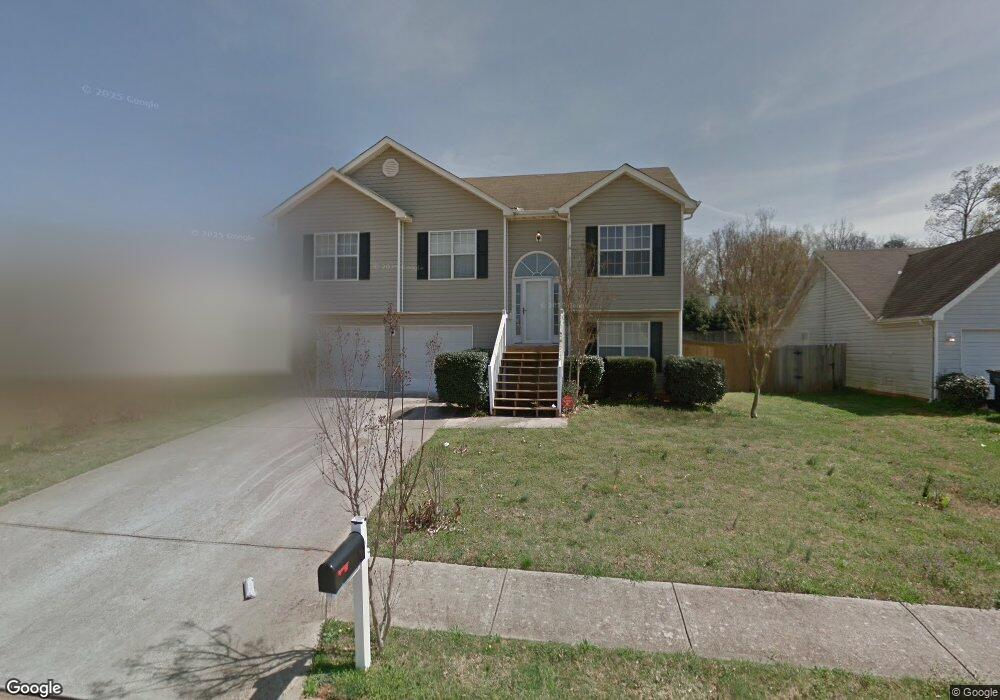
178 Regency Park Dr Unit 3 McDonough, GA 30253
Estimated Value: $237,000 - $266,570
4
Beds
3
Baths
1,708
Sq Ft
$148/Sq Ft
Est. Value
About This Home
This home is located at 178 Regency Park Dr Unit 3, McDonough, GA 30253 and is currently estimated at $252,393, approximately $147 per square foot. 178 Regency Park Dr Unit 3 is a home located in Henry County with nearby schools including Oakland Elementary School, Eagle's Landing Middle School, and Eagle's Landing High School.
Ownership History
Date
Name
Owned For
Owner Type
Purchase Details
Closed on
Jan 10, 2007
Sold by
Williams Lakisha
Bought by
Noel Melisia E
Current Estimated Value
Home Financials for this Owner
Home Financials are based on the most recent Mortgage that was taken out on this home.
Original Mortgage
$108,000
Outstanding Balance
$63,636
Interest Rate
6.05%
Mortgage Type
New Conventional
Estimated Equity
$188,757
Purchase Details
Closed on
May 23, 2005
Sold by
Johnson Rhonda
Bought by
Williams Lakisha S
Home Financials for this Owner
Home Financials are based on the most recent Mortgage that was taken out on this home.
Original Mortgage
$132,950
Interest Rate
9.63%
Mortgage Type
New Conventional
Purchase Details
Closed on
Mar 17, 1999
Sold by
D & N Classic Homes Inc
Bought by
Johnson Rhonda
Home Financials for this Owner
Home Financials are based on the most recent Mortgage that was taken out on this home.
Original Mortgage
$100,349
Interest Rate
6.82%
Mortgage Type
FHA
Create a Home Valuation Report for This Property
The Home Valuation Report is an in-depth analysis detailing your home's value as well as a comparison with similar homes in the area
Home Values in the Area
Average Home Value in this Area
Purchase History
| Date | Buyer | Sale Price | Title Company |
|---|---|---|---|
| Noel Melisia E | $135,000 | -- | |
| Williams Lakisha S | $133,000 | -- | |
| Johnson Rhonda | $100,400 | -- |
Source: Public Records
Mortgage History
| Date | Status | Borrower | Loan Amount |
|---|---|---|---|
| Open | Noel Melisia E | $108,000 | |
| Previous Owner | Williams Lakisha S | $132,950 | |
| Previous Owner | Johnson Rhonda | $100,349 |
Source: Public Records
Tax History Compared to Growth
Tax History
| Year | Tax Paid | Tax Assessment Tax Assessment Total Assessment is a certain percentage of the fair market value that is determined by local assessors to be the total taxable value of land and additions on the property. | Land | Improvement |
|---|---|---|---|---|
| 2025 | $3,931 | $105,320 | $14,000 | $91,320 |
| 2024 | $3,931 | $102,400 | $14,000 | $88,400 |
| 2023 | $3,915 | $104,320 | $12,000 | $92,320 |
| 2022 | $3,052 | $79,360 | $12,000 | $67,360 |
| 2021 | $2,440 | $62,000 | $12,000 | $50,000 |
| 2020 | $2,282 | $57,640 | $8,000 | $49,640 |
| 2019 | $2,144 | $52,560 | $8,000 | $44,560 |
| 2018 | $1,874 | $45,840 | $7,200 | $38,640 |
| 2016 | $1,719 | $41,520 | $7,200 | $34,320 |
| 2015 | $1,665 | $38,600 | $7,200 | $31,400 |
| 2014 | $1,407 | $33,080 | $6,000 | $27,080 |
Source: Public Records
Map
Nearby Homes
- 273 Village Dr
- 205 Coral Cir
- 371 Coral Cir
- 261 Coral Cir
- 433 Kara Ln
- 263 Coral Cir
- 608 Pelican Place
- 326 Coral Cir
- 167 London Dr
- 401 Bainbridge Dr
- 235 London Dr
- 408 Kendall Ln
- 501 Epris Ln Unit 61
- 116 Madeline Ct
- 169 Parkview Place Dr
- 173 Parkview Place Dr
- 121 Parkview Place Dr
- 125 Parkview Place Dr
- 129 Parkview Place Dr
- 38 Head St
- 180 Regency Park Dr
- 180 Regency Park Dr Unit 3
- 176 Regency Park Dr Unit 3
- 620 Fieldcrest Dr Unit 3
- 618 Fieldcrest Dr Unit 3
- 174 Regency Park Dr Unit 3
- 182 Regency Park Dr
- 177 Regency Park Dr
- 179 Regency Park Dr
- 179 Regency Park Dr Unit 3
- 624 Fieldcrest Dr
- 616 Fieldcrest Dr
- 184 Regency Park Dr Unit 3
- 172 Regency Park Dr
- 181 Regency Park Dr
- 626 Fieldcrest Dr Unit 3
- 614 Fieldcrest Dr Unit 3
- 171 Regency Park Dr Unit 3
- 183 Regency Park Dr
- 186 Regency Park Dr