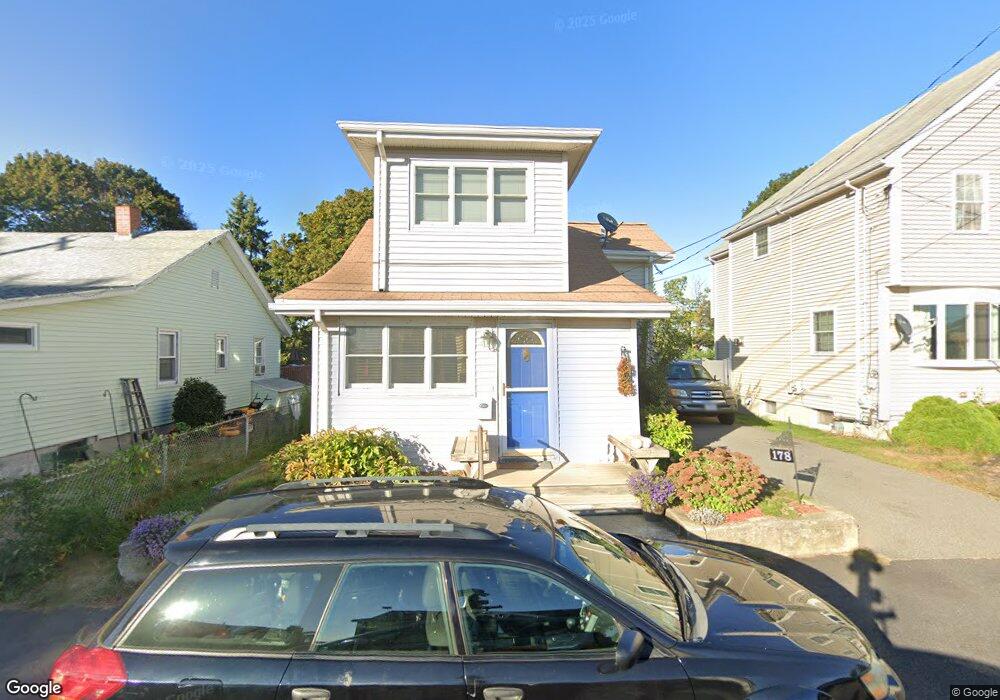
178 Rhoda St Quincy, MA 02169
Houghs Neck NeighborhoodEstimated Value: $585,492 - $708,000
2
Beds
2
Baths
1,589
Sq Ft
$409/Sq Ft
Est. Value
About This Home
This home is located at 178 Rhoda St, Quincy, MA 02169 and is currently estimated at $649,623, approximately $408 per square foot. 178 Rhoda St is a home located in Norfolk County with nearby schools including Atherton Hough Elementary School, Broad Meadows Middle School, and Quincy High School.
Ownership History
Date
Name
Owned For
Owner Type
Purchase Details
Closed on
Dec 3, 2012
Sold by
Gould Jay B
Bought by
Jay B Gould Irt
Current Estimated Value
Purchase Details
Closed on
Mar 25, 1977
Bought by
Delahunt Kerry Jay
Create a Home Valuation Report for This Property
The Home Valuation Report is an in-depth analysis detailing your home's value as well as a comparison with similar homes in the area
Home Values in the Area
Average Home Value in this Area
Purchase History
| Date | Buyer | Sale Price | Title Company |
|---|---|---|---|
| Jay B Gould Irt | -- | -- | |
| Delahunt Kerry Jay | -- | -- |
Source: Public Records
Mortgage History
| Date | Status | Borrower | Loan Amount |
|---|---|---|---|
| Previous Owner | Delahunt Kerry Jay | $99,000 | |
| Previous Owner | Delahunt Kerry Jay | $100,000 | |
| Previous Owner | Delahunt Kerry Jay | $60,000 | |
| Previous Owner | Delahunt Kerry Jay | $30,000 |
Source: Public Records
Tax History Compared to Growth
Tax History
| Year | Tax Paid | Tax Assessment Tax Assessment Total Assessment is a certain percentage of the fair market value that is determined by local assessors to be the total taxable value of land and additions on the property. | Land | Improvement |
|---|---|---|---|---|
| 2025 | $5,764 | $499,900 | $248,100 | $251,800 |
| 2024 | $5,603 | $497,200 | $225,600 | $271,600 |
| 2023 | $5,143 | $462,100 | $205,100 | $257,000 |
| 2022 | $5,229 | $436,500 | $178,300 | $258,200 |
| 2021 | $4,934 | $406,400 | $178,300 | $228,100 |
| 2020 | $4,844 | $389,700 | $178,300 | $211,400 |
| 2019 | $4,690 | $373,700 | $165,100 | $208,600 |
| 2018 | $4,412 | $330,700 | $143,600 | $187,100 |
| 2017 | $4,490 | $316,900 | $143,600 | $173,300 |
| 2016 | $4,177 | $290,900 | $130,500 | $160,400 |
| 2015 | $3,904 | $267,400 | $120,900 | $146,500 |
| 2014 | $3,825 | $257,400 | $120,900 | $136,500 |
Source: Public Records
Map
Nearby Homes