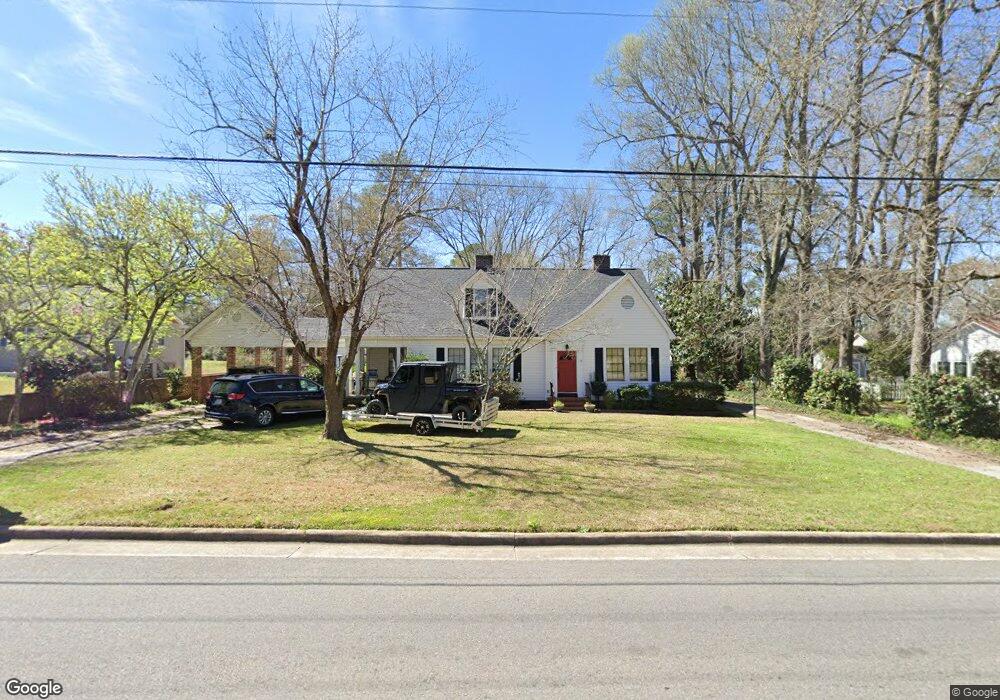
178 S 2nd St Cochran, GA 31014
Estimated Value: $183,000 - $212,000
Studio
2
Baths
2,272
Sq Ft
$86/Sq Ft
Est. Value
About This Home
This home is located at 178 S 2nd St, Cochran, GA 31014 and is currently estimated at $195,545, approximately $86 per square foot. 178 S 2nd St is a home located in Bleckley County with nearby schools including Bleckley County Primary School, Bleckley County Elementary School, and Bleckley Middle School.
Ownership History
Date
Name
Owned For
Owner Type
Purchase Details
Closed on
Nov 30, 2010
Sold by
Anderson Jerald B
Bought by
Anderson Barbara C
Current Estimated Value
Home Financials for this Owner
Home Financials are based on the most recent Mortgage that was taken out on this home.
Original Mortgage
$80,000
Interest Rate
4.31%
Mortgage Type
Balloon
Purchase Details
Closed on
Nov 29, 2010
Sold by
Anderson Barbara C
Bought by
Fisher T W and Fisher Leigh Anne
Home Financials for this Owner
Home Financials are based on the most recent Mortgage that was taken out on this home.
Original Mortgage
$80,000
Interest Rate
4.31%
Mortgage Type
Balloon
Purchase Details
Closed on
May 31, 2005
Sold by
Fisher Joy H
Bought by
Fisher T W and Fisher Leigh Anne
Purchase Details
Closed on
Sep 12, 2003
Sold by
Bryant Samuel
Bought by
Anderson Jerald B and Anderson Barbara C
Purchase Details
Closed on
Jun 1, 2001
Sold by
Bryant Samuel
Bought by
Bryant Samuel
Purchase Details
Closed on
May 23, 2001
Sold by
Garvin Elizabeth H
Bought by
Bryant Samuel
Purchase Details
Closed on
Jan 12, 1973
Bought by
Kemp Garvin D and Kemp Kemp
Create a Home Valuation Report for This Property
The Home Valuation Report is an in-depth analysis detailing your home's value as well as a comparison with similar homes in the area
Home Values in the Area
Average Home Value in this Area
Purchase History
| Date | Buyer | Sale Price | Title Company |
|---|---|---|---|
| Anderson Barbara C | -- | -- | |
| Fisher T W | $100,000 | -- | |
| Fisher T W | $88,683 | -- | |
| Anderson Jerald B | $95,000 | -- | |
| Bryant Samuel | -- | -- | |
| Bryant Samuel | $86,500 | -- | |
| Kemp Garvin D | -- | -- |
Source: Public Records
Mortgage History
| Date | Status | Borrower | Loan Amount |
|---|---|---|---|
| Closed | Fisher T W | $80,000 |
Source: Public Records
Tax History
| Year | Tax Paid | Tax Assessment Tax Assessment Total Assessment is a certain percentage of the fair market value that is determined by local assessors to be the total taxable value of land and additions on the property. | Land | Improvement |
|---|---|---|---|---|
| 2025 | $2,566 | $70,100 | $4,000 | $66,100 |
| 2024 | $2,588 | $70,100 | $4,000 | $66,100 |
| 2023 | $2,809 | $70,100 | $4,000 | $66,100 |
| 2022 | $1,646 | $62,500 | $4,000 | $58,500 |
| 2021 | $1,323 | $48,580 | $4,000 | $44,580 |
| 2020 | $1,106 | $48,580 | $4,000 | $44,580 |
| 2019 | $1,106 | $40,781 | $5,760 | $35,021 |
| 2018 | $1,649 | $40,781 | $5,760 | $35,021 |
| 2017 | $1,120 | $40,781 | $5,760 | $35,021 |
| 2016 | $1,131 | $40,781 | $5,760 | $35,021 |
| 2015 | -- | $40,781 | $5,760 | $35,021 |
| 2014 | -- | $40,781 | $5,760 | $35,021 |
| 2013 | -- | $40,781 | $5,760 | $35,021 |
Source: Public Records
Map
Nearby Homes
- 116 W Lewis St
- 134 Easy St
- 104 S 4th St
- 112 Pecan St
- 116 Pecan St
- 118 Pecan St
- 0 Willow Creek Run
- 1277 Georgia 112
- 140 Racetrack Dr
- 0 Tiffany Dr Unit 10664262
- 188 E Lewis St
- 169 W Dykes St
- 132 Mcvay Dr
- 159 Jockey Ln
- 161 E Cherry St
- 216 E Peter St
- RV Park Mac Thompson Rd
- Land Mac Thompson Rd
- 229 W Peter St
- 113 Taylor Dr
- 174 S 2nd St
- 172 S 2nd St
- 179 S 2nd St
- 183 S 2nd St
- 175 Second Street Ln
- 111 W Lewis St
- 173 Second Street Ln
- 109 Lewis St
- 112 S 2nd St
- 172 SE 2nd St
- 189 S 2nd St
- Trac D-2 Honeysuckle Trace
- 124 Peacock St
- 171 S 2nd St
- 113 W Lewis St
- 106 E Peacock St
- 164 S 2nd St
- 164 SE 2nd St
- 191 Second Street Ln
- 110 W Lewis St
Your Personal Tour Guide
Ask me questions while you tour the home.