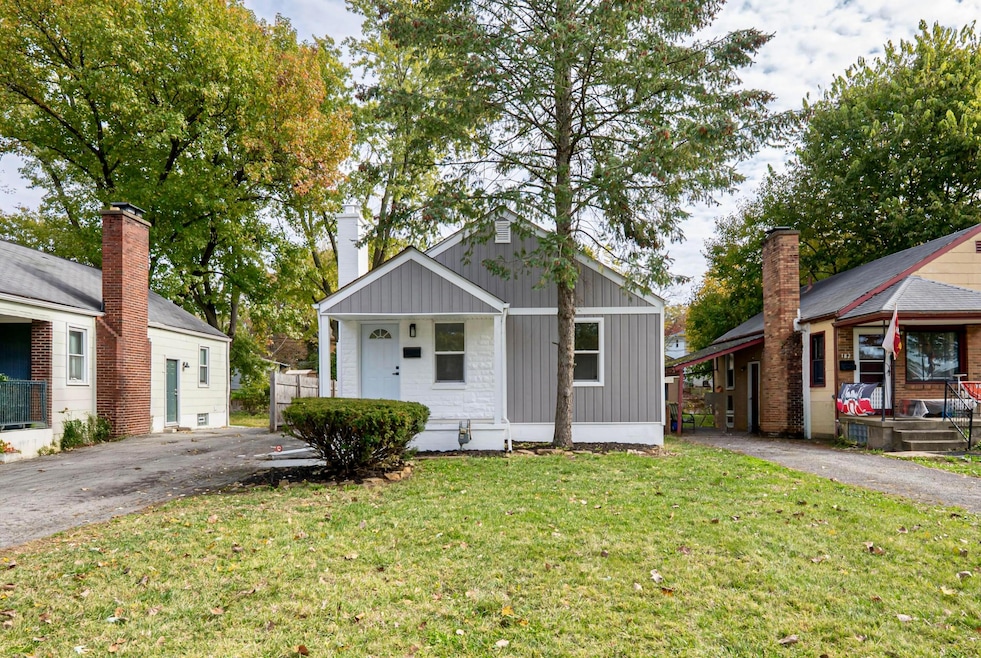
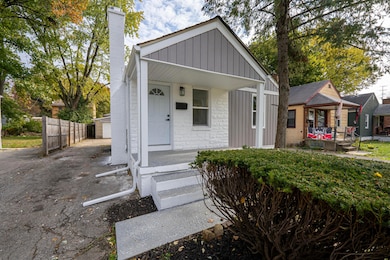
178 S Weyant Ave Columbus, OH 43213
Eastmoor NeighborhoodEstimated payment $1,240/month
Highlights
- Very Popular Property
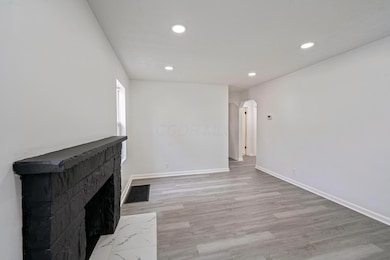
- 1 Fireplace
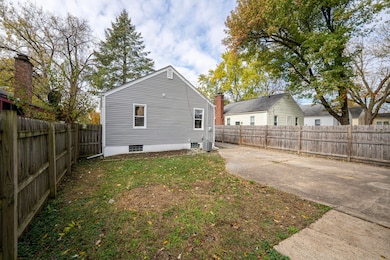
- Fenced Yard
- Ranch Style House
- No HOA
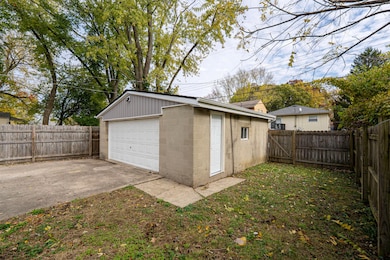
- 2 Car Detached Garage
About This Home
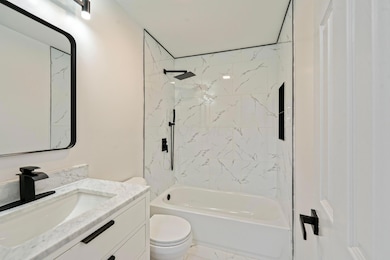
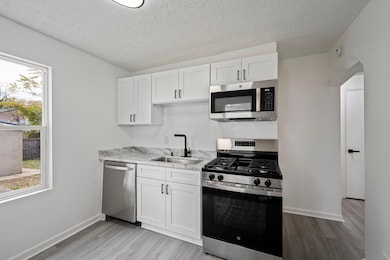
Welcome home to this beautifully renovated 2-bedroom, 1-bath charmer featuring brand-new finishes throughout and stylish updates that make it truly move-in ready! Bright living room with new flooring and fireplace, modern kitchen with white cabinets, granite counters & stainless appliances. Newly finished lower level adds valuable living space. Large 2-car garage with new doors and automated openers on both sides—rare drive-through access! Updates include new roof, electric panel, siding, doors, hardware, and fixtures. Fenced yard, glass block windows add natural light and security, great location near Whitehall parks, Easton Shopping, Bexley, and major highways!
Home Details
Home Type
- Single Family
Est. Annual Taxes
- $2,243
Year Built
- Built in 1951
Lot Details
- 5,227 Sq Ft Lot
- Fenced Yard
Parking
- 2 Car Detached Garage
- Garage Door Opener
- Shared Driveway
Home Design
- Ranch Style House
- Block Foundation
- Vinyl Siding
- Stone Exterior Construction
Interior Spaces
- 1,080 Sq Ft Home
- 1 Fireplace
Kitchen
- Gas Range
- Microwave
- Dishwasher
Bedrooms and Bathrooms
- 2 Main Level Bedrooms
- 1 Full Bathroom
Basement
- Basement Fills Entire Space Under The House
- Recreation or Family Area in Basement
Utilities
- Forced Air Heating and Cooling System
- Heating System Uses Gas
Community Details
- No Home Owners Association
Listing and Financial Details
- Assessor Parcel Number 010-089431
Map
Home Values in the Area
Average Home Value in this Area
Tax History
| Year | Tax Paid | Tax Assessment Tax Assessment Total Assessment is a certain percentage of the fair market value that is determined by local assessors to be the total taxable value of land and additions on the property. | Land | Improvement |
|---|---|---|---|---|
| 2024 | $2,243 | $45,680 | $11,660 | $34,020 |
| 2023 | $2,217 | $45,675 | $11,655 | $34,020 |
| 2022 | $1,819 | $31,400 | $5,080 | $26,320 |
| 2021 | $1,822 | $31,400 | $5,080 | $26,320 |
| 2020 | $1,824 | $31,400 | $5,080 | $26,320 |
| 2019 | $1,752 | $25,770 | $4,240 | $21,530 |
| 2018 | $1,479 | $25,770 | $4,240 | $21,530 |
| 2017 | $1,562 | $25,770 | $4,240 | $21,530 |
| 2016 | $1,496 | $22,580 | $3,780 | $18,800 |
| 2015 | $1,358 | $22,580 | $3,780 | $18,800 |
| 2014 | $1,361 | $22,580 | $3,780 | $18,800 |
| 2013 | $707 | $23,765 | $3,990 | $19,775 |
Property History
| Date | Event | Price | List to Sale | Price per Sq Ft | Prior Sale |
|---|---|---|---|---|---|
| 11/07/2025 11/07/25 | For Sale | $199,900 | +112.7% | $185 / Sq Ft | |
| 08/29/2025 08/29/25 | Sold | $94,000 | -5.9% | $131 / Sq Ft | View Prior Sale |
| 08/13/2025 08/13/25 | Price Changed | $99,900 | -9.2% | $139 / Sq Ft | |
| 07/10/2025 07/10/25 | For Sale | $110,000 | -- | $153 / Sq Ft |
Purchase History
| Date | Type | Sale Price | Title Company |
|---|---|---|---|
| Warranty Deed | $94,000 | Title Connect Agency | |
| Warranty Deed | $70,000 | Golden Title | |
| Interfamily Deed Transfer | -- | None Available | |
| Warranty Deed | $76,000 | Titlequest Agency Inc | |
| Warranty Deed | $39,000 | -- | |
| Sheriffs Deed | $45,000 | -- |
Mortgage History
| Date | Status | Loan Amount | Loan Type |
|---|---|---|---|
| Open | $124,000 | Construction | |
| Previous Owner | $111,638 | Construction | |
| Previous Owner | $73,283 | FHA | |
| Previous Owner | $78,000 | No Value Available |
Source: Columbus and Central Ohio Regional MLS
MLS Number: 225041978
APN: 010-089431
Disclaimer: Certain information contained herein is derived from information provided by parties other than Homes.com. All information provided is deemed reliable, but is not guaranteed to be accurate and should be independently verified.
![]() IDX information is provided exclusively for personal, non-commercial use, and may not be used for any purpose other than to identify prospective properties consumers may be interested in purchasing.
IDX information is provided exclusively for personal, non-commercial use, and may not be used for any purpose other than to identify prospective properties consumers may be interested in purchasing.
Information is deemed reliable but not guaranteed.
- 201 S Weyant Ave
- 91 Maplewood Ave
- 350 S Hampton Rd
- 3755 Doney St
- 46 N Everett Ave
- 88-90 N Waverly St
- 94 N Hampton Rd
- 73 N Everett Ave
- 320 Collingwood Ave
- 247 S James Rd
- 470 S Weyant Ave
- 3814 Elbern Ave
- 277 S James Rd
- 239 S Kellner Rd
- 261 S Kellner Rd
- 430 S James Rd
- 91 Robinwood Ave
- 526 Collingwood Ave
- 3235 Maryland Ave
- 3160 Fair Ave
- 272 S Weyant Ave
- 51 Mayfair Blvd
- 50 N Hampton Rd Unit C
- 50 N Hampton Rd
- 272 Collingwood Ave
- 493 Barnett Rd
- 462 S Hampton Rd
- 65 Robinwood Ave
- 514 Enfield Rd
- 3018 Maryland Ave
- 4052 Ural Ave
- 2877 E Broad St
- 675 Brookside Dr
- 2938 Sherwood Rd
- 4264 E Broad St
- 3058-A Allegheny Ave
- 2977 Barclay Square S
- 2889 Bellwood Ave
- 3345 E 7th Ave
- 2629 E Broad St
