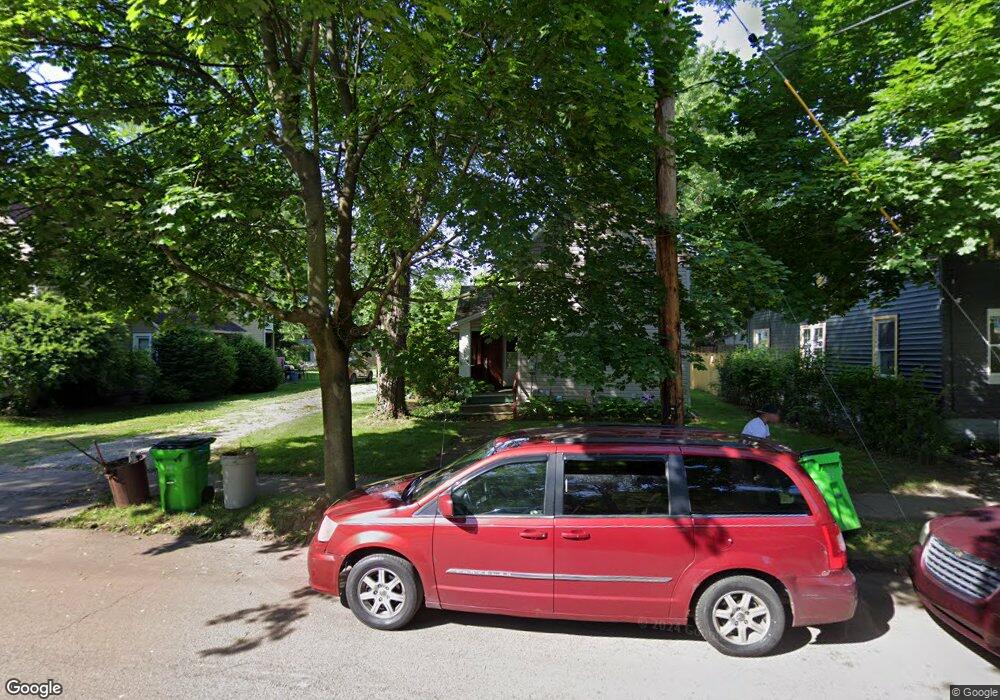
178 Sylvester St Barberton, OH 44203
Estimated Value: $102,466 - $153,000
3
Beds
1
Bath
1,108
Sq Ft
$106/Sq Ft
Est. Value
About This Home
This home is located at 178 Sylvester St, Barberton, OH 44203 and is currently estimated at $117,367, approximately $105 per square foot. 178 Sylvester St is a home located in Summit County with nearby schools including Barberton Middle School, Barberton High School, and St Augustine Elementary School.
Ownership History
Date
Name
Owned For
Owner Type
Purchase Details
Closed on
May 16, 2024
Sold by
Locke Danny B
Bought by
Roberts Tracee J
Current Estimated Value
Purchase Details
Closed on
Mar 8, 2024
Sold by
Locke Danny B
Bought by
Roberts Tracee J
Purchase Details
Closed on
Sep 6, 2023
Sold by
Locke Wayne C
Bought by
Locke Danny B
Purchase Details
Closed on
Aug 25, 2023
Sold by
Locke Wayne C
Bought by
Locke Danny B
Purchase Details
Closed on
Sep 11, 2001
Sold by
Little James E
Bought by
Locke Marie L
Home Financials for this Owner
Home Financials are based on the most recent Mortgage that was taken out on this home.
Original Mortgage
$40,000
Interest Rate
7.03%
Purchase Details
Closed on
Nov 25, 1996
Sold by
Evans Mildred E
Bought by
Little James E
Create a Home Valuation Report for This Property
The Home Valuation Report is an in-depth analysis detailing your home's value as well as a comparison with similar homes in the area
Home Values in the Area
Average Home Value in this Area
Purchase History
| Date | Buyer | Sale Price | Title Company |
|---|---|---|---|
| Roberts Tracee J | -- | Minnesota Title Agency | |
| Roberts Tracee J | -- | Minnesota Title Agency | |
| Locke Danny B | -- | Minn Title | |
| Locke Danny B | -- | Minn Title | |
| Locke Marie L | $50,000 | -- | |
| Little James E | $28,500 | -- |
Source: Public Records
Mortgage History
| Date | Status | Borrower | Loan Amount |
|---|---|---|---|
| Previous Owner | Locke Marie L | $40,000 |
Source: Public Records
Tax History Compared to Growth
Tax History
| Year | Tax Paid | Tax Assessment Tax Assessment Total Assessment is a certain percentage of the fair market value that is determined by local assessors to be the total taxable value of land and additions on the property. | Land | Improvement |
|---|---|---|---|---|
| 2025 | $2,102 | $24,732 | $7,298 | $17,434 |
| 2024 | $2,102 | $24,732 | $7,298 | $17,434 |
| 2023 | $2,102 | $24,732 | $7,298 | $17,434 |
| 2022 | $603 | $19,145 | $5,614 | $13,531 |
| 2021 | $603 | $19,145 | $5,614 | $13,531 |
| 2020 | $590 | $19,140 | $5,610 | $13,530 |
| 2019 | $416 | $15,370 | $6,510 | $8,860 |
| 2018 | $410 | $15,370 | $6,510 | $8,860 |
| 2017 | $521 | $15,370 | $6,510 | $8,860 |
| 2016 | $522 | $17,070 | $6,510 | $10,560 |
| 2015 | $521 | $17,070 | $6,510 | $10,560 |
| 2014 | $518 | $17,070 | $6,510 | $10,560 |
| 2013 | $500 | $17,070 | $6,510 | $10,560 |
Source: Public Records
Map
Nearby Homes
- 387 4th St NW
- 583 Creedmore Ave
- 46 Brown St
- 564 W Hopocan Ave
- 39 Brown St
- 610 Creedmore Ave
- 553 Princeton Ave
- 636 Wesleyan Ave
- 613 Wooster Rd N
- 217 W Summit St
- 344 E Huston St
- 673 Wooster Rd W
- 349 E Hopocan Ave
- 645 Madison Ave
- 679 Wooster Rd W
- 0 Wooster Rd N
- 357 E Paige Ave
- 25 S Van Buren Ave
- 43 S Van Buren Ave
- 412 Grandview Ave