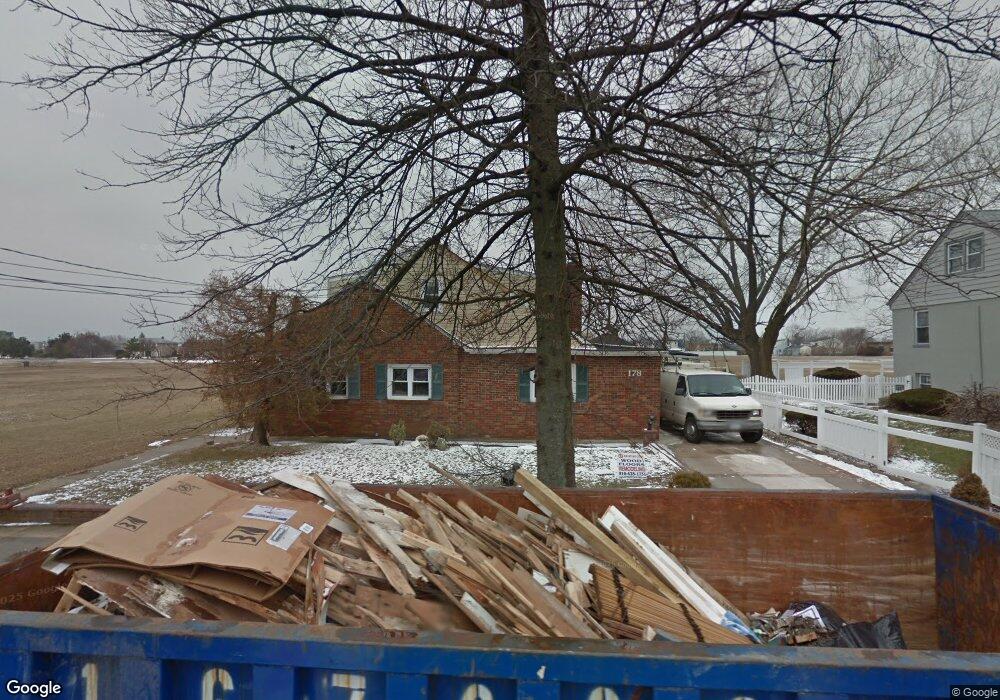
178 Trafalgar Blvd Island Park, NY 11558
Estimated Value: $804,000 - $826,877
7
Beds
4
Baths
2,105
Sq Ft
$387/Sq Ft
Est. Value
About This Home
This home is located at 178 Trafalgar Blvd, Island Park, NY 11558 and is currently estimated at $815,439, approximately $387 per square foot. 178 Trafalgar Blvd is a home located in Nassau County with nearby schools including Francis X Hegarty Elementary School, Lincoln Orens Middle School, and Hebrew Academy of Long Beach.
Ownership History
Date
Name
Owned For
Owner Type
Purchase Details
Closed on
Nov 17, 2022
Sold by
132 Liberty Llc
Bought by
Ajibulu Adetokunbo
Current Estimated Value
Home Financials for this Owner
Home Financials are based on the most recent Mortgage that was taken out on this home.
Original Mortgage
$723,529
Outstanding Balance
$701,093
Interest Rate
6.95%
Mortgage Type
VA
Estimated Equity
$114,346
Purchase Details
Closed on
Aug 20, 2021
Sold by
Gaspar Julio
Bought by
132 Liberty Llc
Home Financials for this Owner
Home Financials are based on the most recent Mortgage that was taken out on this home.
Original Mortgage
$200,000
Interest Rate
2.8%
Mortgage Type
Seller Take Back
Purchase Details
Closed on
Apr 11, 2006
Sold by
Gaspar Claudia
Purchase Details
Closed on
Feb 5, 1998
Sold by
Lazrovitch Stanley and Lazrovitch Mabel
Bought by
Gaspar Claudia
Create a Home Valuation Report for This Property
The Home Valuation Report is an in-depth analysis detailing your home's value as well as a comparison with similar homes in the area
Home Values in the Area
Average Home Value in this Area
Purchase History
| Date | Buyer | Sale Price | Title Company |
|---|---|---|---|
| Ajibulu Adetokunbo | $707,262 | East Coast Abstract Inc | |
| 132 Liberty Llc | $430,000 | Chicago Title | |
| -- | $537,500 | -- | |
| Gaspar Claudia | $187,000 | -- |
Source: Public Records
Mortgage History
| Date | Status | Borrower | Loan Amount |
|---|---|---|---|
| Open | Ajibulu Adetokunbo | $723,529 | |
| Previous Owner | 132 Liberty Llc | $200,000 |
Source: Public Records
Tax History Compared to Growth
Tax History
| Year | Tax Paid | Tax Assessment Tax Assessment Total Assessment is a certain percentage of the fair market value that is determined by local assessors to be the total taxable value of land and additions on the property. | Land | Improvement |
|---|---|---|---|---|
| 2025 | $11,786 | $476 | $196 | $280 |
| 2024 | $3,453 | $476 | $196 | $280 |
| 2023 | $10,467 | $476 | $196 | $280 |
| 2022 | $10,467 | $476 | $196 | $280 |
| 2021 | $13,449 | $452 | $186 | $266 |
| 2020 | $10,387 | $865 | $576 | $289 |
| 2019 | $3,731 | $865 | $576 | $289 |
| 2018 | $6,202 | $865 | $0 | $0 |
| 2017 | $5,958 | $865 | $576 | $289 |
| 2016 | $9,438 | $865 | $576 | $289 |
| 2015 | $3,264 | $865 | $576 | $289 |
| 2014 | $3,264 | $865 | $576 | $289 |
| 2013 | $3,045 | $865 | $576 | $289 |
Source: Public Records
Map
Nearby Homes
- 210 Saratoga Blvd
- 4081 Massachusetts Ave
- 187 Nassau Ln
- 31 Parente Ln N
- 65 Florida Ave
- 541 Long Beach Rd
- 255 Delaware Ave
- 41 Newport Rd
- 33 Newport Rd
- 80 Newport Rd
- 175 Hamilton Ave
- 41 Ostend Rd
- 104 Ostend Rd
- 86 Empire Blvd
- 0 Nevada Ave
- 163 Vanderbilt Ave
- 9 Hamilton Ave
- 19 Parma Rd
- 227 Sunset Ave
- 169 Sunset Ave
- 170 Trafalgar Blvd
- 189 Trafalgar Blvd
- 177 Trafalgar Blvd
- 169 Trafalgar Blvd
- 4146 New York Ave
- 163 Trafalgar Blvd
- 4155 New York Ave
- 4140 New York Ave
- 155 Trafalgar Blvd
- 147 Trafalgar Blvd
- 4141 New York Ave
- 203 Trafalgar Blvd
- 143 Trafalgar Blvd
- 209 Trafalgar Blvd
- 137 Trafalgar Blvd
- 138 Atlantic Place S
- 215 Trafalgar Blvd
- 133 Trafalgar Blvd
- 219 Trafalgar Blvd
- 134 Atlantic Place S