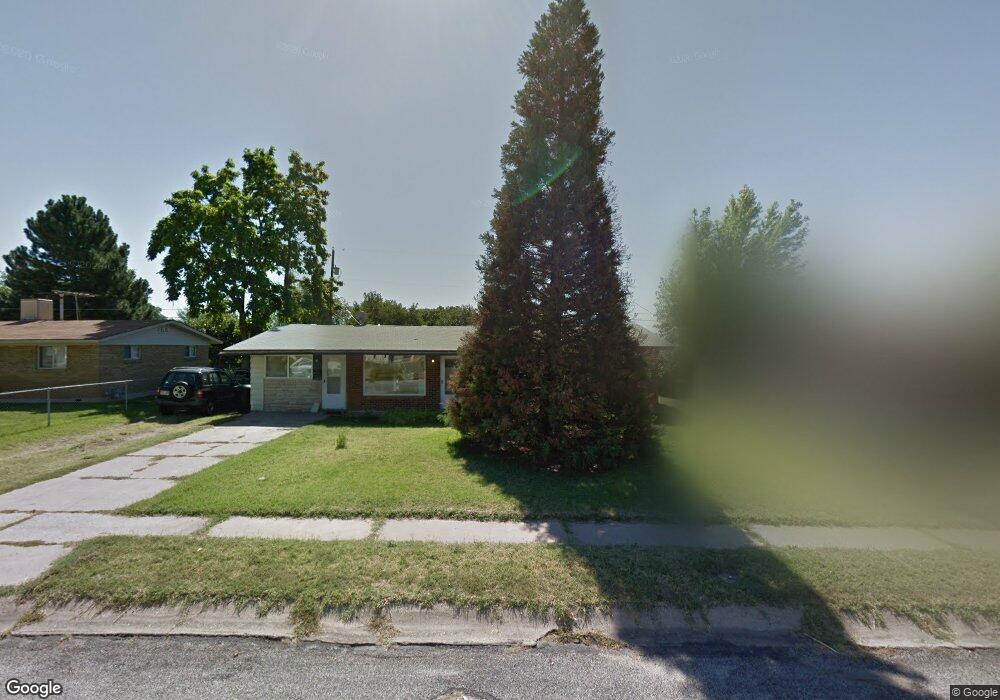
178 W 600 N Clearfield, UT 84015
Estimated Value: $370,000 - $430,000
4
Beds
2
Baths
1,672
Sq Ft
$241/Sq Ft
Est. Value
About This Home
This home is located at 178 W 600 N, Clearfield, UT 84015 and is currently estimated at $403,751, approximately $241 per square foot. 178 W 600 N is a home located in Davis County with nearby schools including Doxey Elementary School, North Davis Junior High School, and Clearfield High School.
Ownership History
Date
Name
Owned For
Owner Type
Purchase Details
Closed on
Apr 13, 2022
Sold by
Breckenridge Property Fund 2016 Llc
Bought by
Arndt Sayer and Arndt Natalie
Current Estimated Value
Home Financials for this Owner
Home Financials are based on the most recent Mortgage that was taken out on this home.
Original Mortgage
$387,600
Outstanding Balance
$359,484
Interest Rate
3.76%
Mortgage Type
New Conventional
Estimated Equity
$44,267
Purchase Details
Closed on
Oct 28, 2021
Sold by
Smalley Peter J and Estate Of Sarah Jean Lundgreen
Bought by
Breckenridge Property Fund 2016 Llc and Wedgewood Llc
Create a Home Valuation Report for This Property
The Home Valuation Report is an in-depth analysis detailing your home's value as well as a comparison with similar homes in the area
Home Values in the Area
Average Home Value in this Area
Purchase History
| Date | Buyer | Sale Price | Title Company |
|---|---|---|---|
| Arndt Sayer | -- | Security Title & Abstract | |
| Breckenridge Property Fund 2016 Llc | -- | Real Advantage Ttl Ins Agcy |
Source: Public Records
Mortgage History
| Date | Status | Borrower | Loan Amount |
|---|---|---|---|
| Open | Arndt Sayer | $387,600 |
Source: Public Records
Tax History
| Year | Tax Paid | Tax Assessment Tax Assessment Total Assessment is a certain percentage of the fair market value that is determined by local assessors to be the total taxable value of land and additions on the property. | Land | Improvement |
|---|---|---|---|---|
| 2025 | $2,357 | $211,200 | $80,185 | $131,015 |
| 2024 | $2,291 | $206,800 | $76,601 | $130,199 |
| 2023 | $2,125 | $352,000 | $121,762 | $230,238 |
| 2022 | $1,626 | $265,000 | $126,420 | $138,580 |
| 2021 | $1,684 | $228,000 | $78,417 | $149,583 |
| 2020 | $1,465 | $197,000 | $66,833 | $130,167 |
| 2019 | $1,431 | $190,000 | $66,829 | $123,171 |
| 2018 | $1,284 | $166,000 | $56,352 | $109,648 |
| 2016 | $1,115 | $75,350 | $24,001 | $51,349 |
| 2015 | $1,067 | $68,750 | $24,001 | $44,749 |
| 2014 | $1,086 | $70,953 | $24,001 | $46,952 |
| 2013 | -- | $72,909 | $24,833 | $48,076 |
Source: Public Records
Map
Nearby Homes
- 62 Villa Dr
- 47 Villa Dr
- 143 W 650 N
- 463 N 200 W
- 482 Vickie Ln
- 150 W 750 N
- 156 W 300 N
- 4356 W 475 S
- 54 W 250 N
- 137 W 250 N
- 285 N Main St Unit 308
- 446 Fern Dr
- 482 W 275 N
- 75 W 250 N Unit 12
- 75 W 250 N Unit 31
- 75 W 250 N Unit 84
- 75 W 250 N Unit 110
- 75 W 250 N Unit 13
- 75 W 250 N Unit 56
- 75 W 250 N Unit 78
Your Personal Tour Guide
Ask me questions while you tour the home.