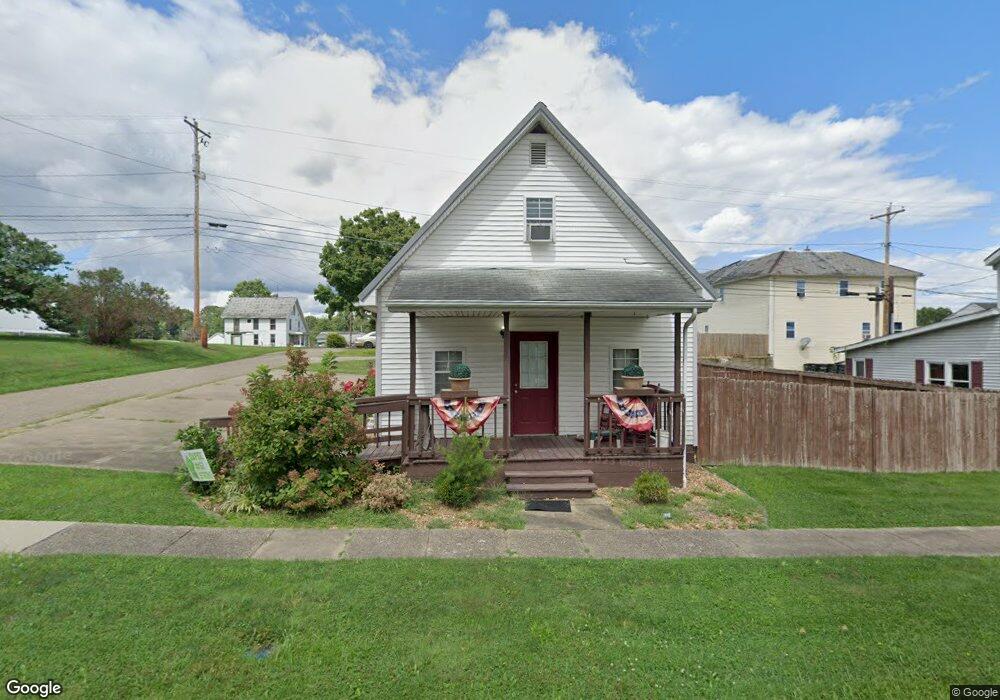
1780 Broadway St Stockport, OH 43787
Estimated Value: $73,000 - $130,000
1
Bed
1
Bath
968
Sq Ft
$104/Sq Ft
Est. Value
About This Home
This home is located at 1780 Broadway St, Stockport, OH 43787 and is currently estimated at $100,477, approximately $103 per square foot. 1780 Broadway St is a home with nearby schools including Morgan High School.
Ownership History
Date
Name
Owned For
Owner Type
Purchase Details
Closed on
Nov 21, 2011
Sold by
Eckert Philip D and Eckert Charlene F
Bought by
Dodd David A and Dodd Tonya R
Current Estimated Value
Home Financials for this Owner
Home Financials are based on the most recent Mortgage that was taken out on this home.
Original Mortgage
$35,000
Outstanding Balance
$16,191
Interest Rate
6.9%
Mortgage Type
Commercial
Estimated Equity
$84,286
Purchase Details
Closed on
Dec 4, 2001
Sold by
Armstrong Gary and Kincaid Brenda J
Bought by
Eckert Charlene and Eckert Philip
Purchase Details
Closed on
May 30, 2000
Sold by
Rogers Margery E
Bought by
Armstrong Gary and Kincaid Brenda J
Purchase Details
Closed on
Sep 25, 1998
Sold by
Rogers Margery E
Bought by
Rogers Margery E
Purchase Details
Closed on
Jun 19, 1998
Sold by
Rogers Eldon E and Rogers Margery E
Bought by
Rogers Margery E
Purchase Details
Closed on
May 18, 1992
Sold by
Hudnall Lauren Jean
Bought by
Rogers Eldon E and Rogers Margery E
Purchase Details
Closed on
May 1, 1992
Purchase Details
Closed on
May 1, 1985
Create a Home Valuation Report for This Property
The Home Valuation Report is an in-depth analysis detailing your home's value as well as a comparison with similar homes in the area
Home Values in the Area
Average Home Value in this Area
Purchase History
| Date | Buyer | Sale Price | Title Company |
|---|---|---|---|
| Dodd David A | $50,000 | None Available | |
| Eckert Charlene | $23,000 | -- | |
| Armstrong Gary | $8,000 | -- | |
| Rogers Margery E | $8,500 | -- | |
| Rogers Margery E | -- | -- | |
| Rogers Eldon E | $8,500 | -- | |
| -- | $8,500 | -- | |
| -- | $5,500 | -- |
Source: Public Records
Mortgage History
| Date | Status | Borrower | Loan Amount |
|---|---|---|---|
| Open | Dodd David A | $35,000 |
Source: Public Records
Tax History Compared to Growth
Tax History
| Year | Tax Paid | Tax Assessment Tax Assessment Total Assessment is a certain percentage of the fair market value that is determined by local assessors to be the total taxable value of land and additions on the property. | Land | Improvement |
|---|---|---|---|---|
| 2024 | $748 | $21,310 | $950 | $20,360 |
| 2023 | $748 | $13,500 | $1,090 | $12,410 |
| 2022 | $488 | $13,500 | $1,090 | $12,410 |
| 2021 | $465 | $13,500 | $1,090 | $12,410 |
| 2019 | $434 | $11,970 | $950 | $11,020 |
| 2018 | $419 | $11,970 | $950 | $11,020 |
| 2017 | $528 | $10,644 | $945 | $9,699 |
| 2016 | $527 | $10,644 | $945 | $9,699 |
| 2015 | $817 | $10,644 | $945 | $9,699 |
| 2014 | $537 | $10,644 | $945 | $9,699 |
| 2013 | $528 | $10,644 | $945 | $9,699 |
Source: Public Records
Map
Nearby Homes
- 1960 Broadway St
- 1920 North St
- 1770 Broadway St
- 1715 South St
- 0 Meadow St Unit Lot 9 5158299
- 0 Meadow St Unit Lot 9 225008020
- 3265 Tieber Rd
- 75 S River Rd SE
- 3020 State Route 376
- 2712 Sycamore Ln
- 2444 Ervin Ln
- 3111 Big Bottom Ln
- 0 Kosky Dr
- 3291 Kosky Dr
- 5174 Lightner Ridge Rd
- 681 Downing Rd
- 781 Downing Rd
- 0 Downing Rd
- 160 N Riverview Rd
- 4660 E J Ross Ln