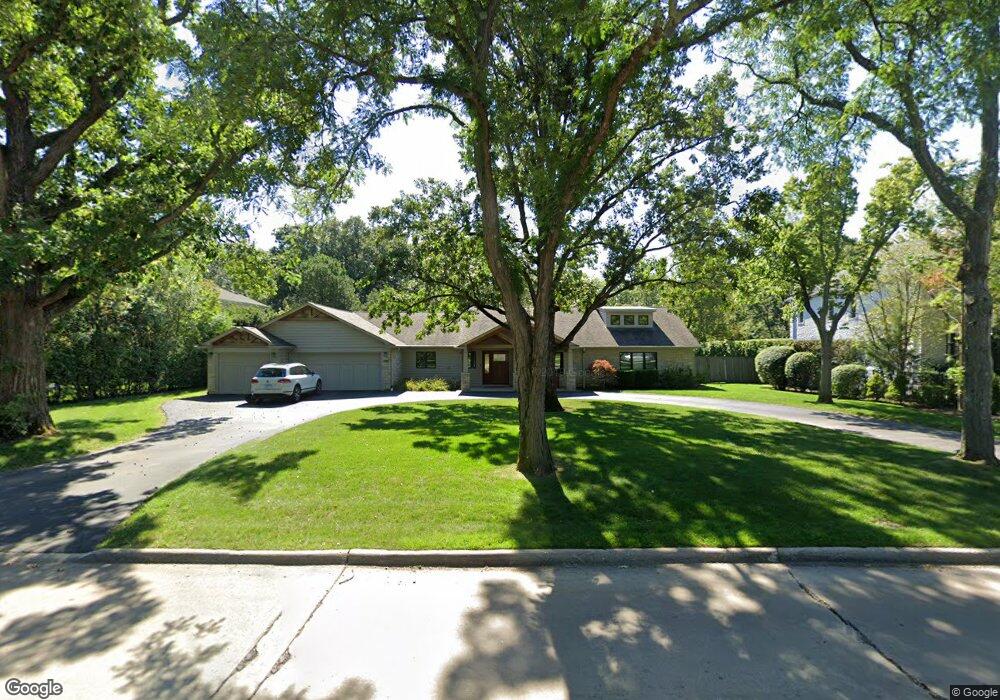
1780 Clavey Rd Highland Park, IL 60035
West Highland Park NeighborhoodEstimated Value: $1,089,000 - $1,309,000
--
Bed
3
Baths
4,229
Sq Ft
$285/Sq Ft
Est. Value
About This Home
This home is located at 1780 Clavey Rd, Highland Park, IL 60035 and is currently estimated at $1,206,831, approximately $285 per square foot. 1780 Clavey Rd is a home located in Lake County with nearby schools including Sherwood Elementary School, Edgewood Middle School, and Highland Park High School.
Ownership History
Date
Name
Owned For
Owner Type
Purchase Details
Closed on
Nov 22, 2022
Sold by
Garland Jill Michele
Bought by
Jill Michele Garland Revocable Trust
Current Estimated Value
Purchase Details
Closed on
Aug 23, 2011
Sold by
Sjb Management Corporation
Bought by
Bernsen Jill M
Purchase Details
Closed on
Jun 11, 2007
Sold by
Bernsen Stuart J and Bernsen Jill
Bought by
Sjb Management Corp
Purchase Details
Closed on
Aug 11, 2006
Sold by
Sjb Management Corp
Bought by
Bernsen Stuart J and Bernsen Jill
Home Financials for this Owner
Home Financials are based on the most recent Mortgage that was taken out on this home.
Original Mortgage
$417,000
Interest Rate
6.37%
Mortgage Type
Purchase Money Mortgage
Purchase Details
Closed on
Oct 29, 2002
Sold by
Holtzman Toby R and Noie Thomas N
Bought by
Bernsen Stuart J and Bernsen Jill M
Home Financials for this Owner
Home Financials are based on the most recent Mortgage that was taken out on this home.
Original Mortgage
$630,000
Interest Rate
4.75%
Create a Home Valuation Report for This Property
The Home Valuation Report is an in-depth analysis detailing your home's value as well as a comparison with similar homes in the area
Home Values in the Area
Average Home Value in this Area
Purchase History
| Date | Buyer | Sale Price | Title Company |
|---|---|---|---|
| Jill Michele Garland Revocable Trust | -- | -- | |
| Bernsen Jill M | $200,000 | None Available | |
| Sjb Management Corp | -- | None Available | |
| Bernsen Stuart J | -- | Prairie Title | |
| Bernsen Stuart J | $650,000 | -- |
Source: Public Records
Mortgage History
| Date | Status | Borrower | Loan Amount |
|---|---|---|---|
| Previous Owner | Bernsen Stuart J | $417,000 | |
| Previous Owner | Bernsen Stuart J | $630,000 |
Source: Public Records
Tax History Compared to Growth
Tax History
| Year | Tax Paid | Tax Assessment Tax Assessment Total Assessment is a certain percentage of the fair market value that is determined by local assessors to be the total taxable value of land and additions on the property. | Land | Improvement |
|---|---|---|---|---|
| 2024 | $24,836 | $322,553 | $110,062 | $212,491 |
| 2023 | $22,673 | $290,746 | $99,209 | $191,537 |
| 2022 | $22,673 | $257,421 | $108,987 | $148,434 |
| 2021 | $20,905 | $248,836 | $105,352 | $143,484 |
| 2020 | $20,229 | $248,836 | $105,352 | $143,484 |
| 2019 | $19,548 | $247,672 | $104,859 | $142,813 |
| 2018 | $22,450 | $300,242 | $116,722 | $183,520 |
| 2017 | $22,100 | $298,511 | $116,049 | $182,462 |
| 2016 | $21,312 | $284,188 | $110,481 | $173,707 |
| 2015 | $20,630 | $264,042 | $102,649 | $161,393 |
| 2014 | $18,177 | $227,979 | $103,948 | $124,031 |
| 2012 | $17,678 | $229,309 | $104,554 | $124,755 |
Source: Public Records
Map
Nearby Homes
- 1816 Rosemary Rd
- 513 Sumac Rd
- 263 Barberry Rd
- 666 Barberry Rd
- 1490 Avignon Ct
- 1795 Lake Cook Rd Unit 110
- 810 Virginia Rd
- 1280 Rudolph Rd Unit 1
- 1220 Rudolph Rd Unit 3A
- 95 Greenbriar Dr E
- 1773 Winthrop Rd
- 75 Eastwood Dr
- 49 Larkdale Rd
- 1039 Deerfield Place Unit 1039
- 1744 Walnut Cir
- 1921 Beechnut Rd
- 75 Mulberry Rd
- 850 Evergreen Way
- 300 Red Oak Rd
- 1380 Rosemary Ln
- 1760 Clavey Rd
- 1790 Clavey Rd
- 1765 Blossom Ct
- 1750 Clavey Rd
- 355 Russett Ln
- 415 Ellridge Cir
- 1825 Balsam Rd
- 1791 Clavey Rd
- 1770 Blossom Ct
- 1807 Balsam Rd
- 1761 Clavey Rd
- 384 Ridge Rd
- 368 Ridge Rd
- 375 Russett Ln
- 1751 Clavey Rd
- 335 Russett Ln
- 1766 Blossom Ct
- 1843 Balsam Rd
- 414 Ridge Rd
- 433 Ellridge Cir