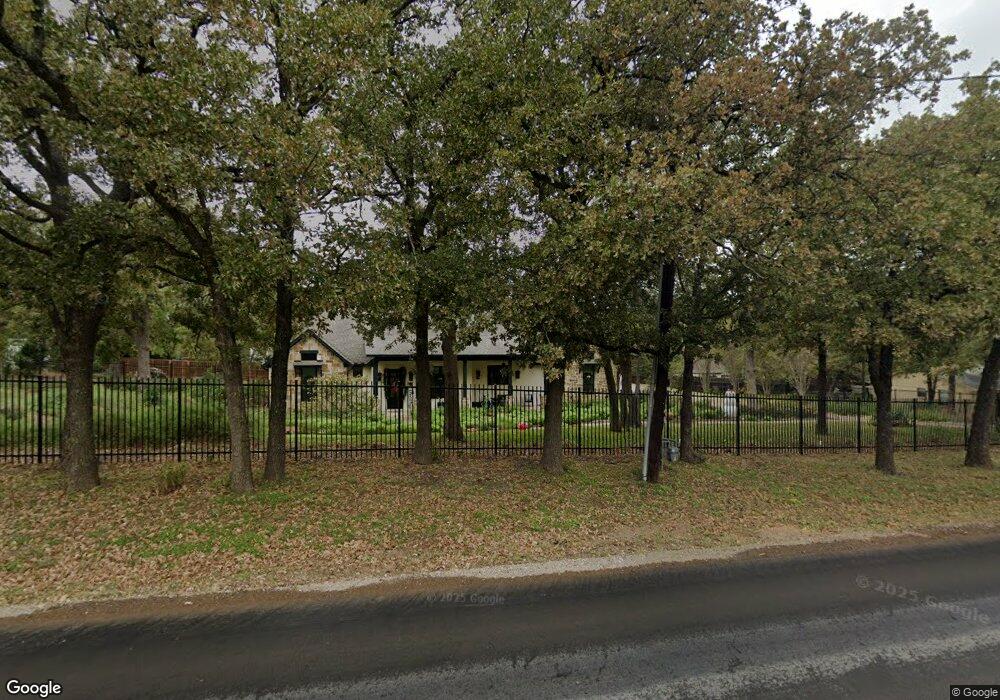
1780 N Kimball Ave Southlake, TX 76092
Estimated Value: $1,293,707 - $1,536,000
3
Beds
3
Baths
3,154
Sq Ft
$438/Sq Ft
Est. Value
About This Home
This home is located at 1780 N Kimball Ave, Southlake, TX 76092 and is currently estimated at $1,381,177, approximately $437 per square foot. 1780 N Kimball Ave is a home located in Tarrant County with nearby schools including Jack D. Johnson Elementary, Don T. Durham Intermediate School, and Carroll Middle School.
Ownership History
Date
Name
Owned For
Owner Type
Purchase Details
Closed on
Jul 22, 2019
Sold by
Prinz Martin W and Prinz Jane
Bought by
Conroy Michael A and Conroy Karen E
Current Estimated Value
Home Financials for this Owner
Home Financials are based on the most recent Mortgage that was taken out on this home.
Original Mortgage
$300,000
Outstanding Balance
$262,827
Interest Rate
3.82%
Mortgage Type
New Conventional
Estimated Equity
$1,118,350
Create a Home Valuation Report for This Property
The Home Valuation Report is an in-depth analysis detailing your home's value as well as a comparison with similar homes in the area
Home Values in the Area
Average Home Value in this Area
Purchase History
| Date | Buyer | Sale Price | Title Company |
|---|---|---|---|
| Conroy Michael A | -- | None Available |
Source: Public Records
Mortgage History
| Date | Status | Borrower | Loan Amount |
|---|---|---|---|
| Open | Conroy Michael A | $300,000 |
Source: Public Records
Tax History Compared to Growth
Tax History
| Year | Tax Paid | Tax Assessment Tax Assessment Total Assessment is a certain percentage of the fair market value that is determined by local assessors to be the total taxable value of land and additions on the property. | Land | Improvement |
|---|---|---|---|---|
| 2025 | $12,403 | $1,300,000 | $519,210 | $780,790 |
| 2024 | $12,403 | $1,300,000 | $519,210 | $780,790 |
| 2023 | $17,525 | $1,243,754 | $519,210 | $724,544 |
| 2022 | $18,858 | $921,716 | $370,175 | $551,541 |
| 2021 | $18,118 | $794,641 | $370,175 | $424,466 |
| 2020 | $17,225 | $749,352 | $441,315 | $308,037 |
| 2019 | $12,270 | $825,086 | $441,315 | $383,771 |
| 2018 | $7,138 | $460,661 | $441,315 | $19,346 |
| 2017 | $10,380 | $495,700 | $245,175 | $250,525 |
| 2016 | $9,436 | $510,007 | $245,175 | $264,832 |
| 2015 | $6,898 | $346,100 | $75,000 | $271,100 |
| 2014 | $6,898 | $346,100 | $75,000 | $271,100 |
Source: Public Records
Map
Nearby Homes
- 2023 Harwell St
- 2040 E Dove Rd
- 2944 Chris Ln
- 1480 N Kimball Ave
- 2080 E Dove Rd Unit Lot 4
- 2080 E Dove Rd Unit Lots 1, 2, 4, 5, 6
- 2080 E Dove Rd Unit Lot 2
- 2080 E (Lot 1) Dove Rd
- 2080 E Dove Rd Unit Lot 6
- 2002 Harwell St
- 2941 Kosse Ct
- 1963 E Dove Rd
- Walker Plan at Dove Station
- Florence Plan at Dove Station
- Jade Plan at Dove Station
- 2947 Kosse Ct
- 1469 Sunshine Ln
- 2954 Trail Lake Dr
- 1459 Sunshine Ln
- 2709 Cobblestone Dr
- 1800 N Kimball Ave
- 1713 Torian Ln
- 1709 Torian Ln
- 2703 Pebble Stone
- 2705 Pebble Stone
- 1717 Torian Ln
- 2701 Pebble Stone
- 2707 Pebble Stone
- 2656 Pinehurst Dr
- 1790 N Kimball Ave
- 2316 N Kimball Ave
- 1721 Torian Ln
- 1721 Torian Ln
- 1721 Torian Ln
- 1721 Torian Ln
- 2330 Kimball Glen Ct
- 2334 Kimball Glen Ct
- 2659 Pinehurst Dr
- 2658 Pinehurst Dr
- 2709 Pebble Stone