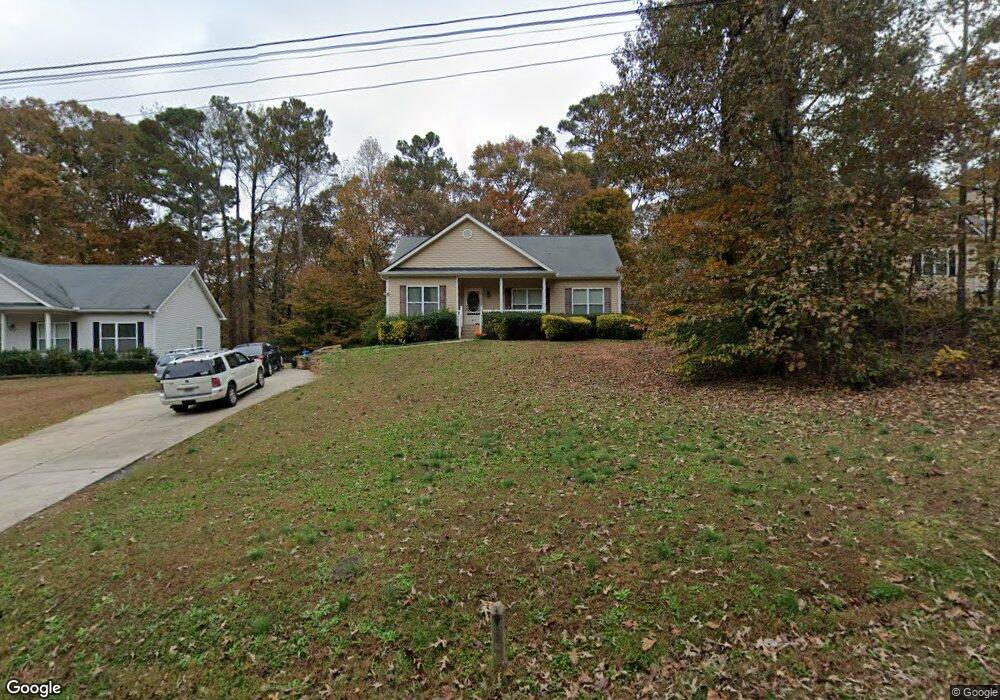
1780 Pine Forrest Dr Acworth, GA 30102
Oak Grove NeighborhoodEstimated Value: $305,099 - $333,000
3
Beds
2
Baths
1,261
Sq Ft
$253/Sq Ft
Est. Value
About This Home
This home is located at 1780 Pine Forrest Dr, Acworth, GA 30102 and is currently estimated at $319,050, approximately $253 per square foot. 1780 Pine Forrest Dr is a home located in Cherokee County with nearby schools including E. T. Booth Middle School, Etowah High School, and Keystone Prep Academy.
Ownership History
Date
Name
Owned For
Owner Type
Purchase Details
Closed on
Jun 22, 2015
Sold by
Rio Assets Llc
Bought by
Bronner Shlomo
Current Estimated Value
Purchase Details
Closed on
Jun 28, 2012
Sold by
Dfrp Note Purchase Partner
Bought by
Rio Assets Llc
Purchase Details
Closed on
Dec 6, 2011
Sold by
Moura Ricardo
Bought by
Dfrp Note Purchase Partners I
Purchase Details
Closed on
Mar 16, 2007
Sold by
Moura Ricardo
Bought by
Moura Ricardo and Moura Anneliese S
Home Financials for this Owner
Home Financials are based on the most recent Mortgage that was taken out on this home.
Original Mortgage
$145,000
Interest Rate
6.22%
Mortgage Type
New Conventional
Purchase Details
Closed on
Mar 5, 2007
Sold by
Lucas Estates Llc
Bought by
Moura Ricardo
Home Financials for this Owner
Home Financials are based on the most recent Mortgage that was taken out on this home.
Original Mortgage
$145,000
Interest Rate
6.22%
Mortgage Type
New Conventional
Create a Home Valuation Report for This Property
The Home Valuation Report is an in-depth analysis detailing your home's value as well as a comparison with similar homes in the area
Home Values in the Area
Average Home Value in this Area
Purchase History
| Date | Buyer | Sale Price | Title Company |
|---|---|---|---|
| Bronner Shlomo | $82,800 | -- | |
| Rio Assets Llc | $79,000 | -- | |
| Dfrp Note Purchase Partners I | $99,000 | -- | |
| Moura Ricardo | -- | -- | |
| Moura Ricardo | $145,000 | -- |
Source: Public Records
Mortgage History
| Date | Status | Borrower | Loan Amount |
|---|---|---|---|
| Previous Owner | Moura Ricardo | $145,000 |
Source: Public Records
Tax History Compared to Growth
Tax History
| Year | Tax Paid | Tax Assessment Tax Assessment Total Assessment is a certain percentage of the fair market value that is determined by local assessors to be the total taxable value of land and additions on the property. | Land | Improvement |
|---|---|---|---|---|
| 2025 | $3,105 | $118,240 | $24,000 | $94,240 |
| 2024 | $2,762 | $106,280 | $16,000 | $90,280 |
| 2023 | $3,079 | $118,480 | $22,000 | $96,480 |
| 2022 | $2,432 | $92,520 | $20,000 | $72,520 |
| 2021 | $2,408 | $84,840 | $15,600 | $69,240 |
| 2020 | $2,177 | $76,600 | $12,800 | $63,800 |
| 2019 | $1,911 | $67,240 | $12,000 | $55,240 |
| 2018 | $1,564 | $54,720 | $8,800 | $45,920 |
| 2017 | $1,530 | $132,800 | $8,800 | $44,320 |
| 2016 | $1,262 | $108,400 | $8,800 | $34,560 |
| 2015 | $1,169 | $99,400 | $7,800 | $31,960 |
| 2014 | $1,171 | $99,400 | $7,800 | $31,960 |
Source: Public Records
Map
Nearby Homes
- 400 Sable Trace Cove
- 5574 Oak Grove Dr
- 626 Spanish Oak Dr
- 423 Royal Oak Dr
- 1768 Balsa Ln
- 271 Oak Grove Way
- 4915 Highway 92
- 402 Royal Oak Dr
- 154 Bryon Ln
- 140 Bryon Ln
- 4645 Highway 92
- 148 Sable Trace Trail
- 4771 Highway 92
- 0 W Hwy 92 Unit 7354851
- 6312 Woodstock Rd
- 5666 Goldfield Dr
- 6390 Woodstock Rd
- 0 Alabama Rd
- 313 Maltibie Dr
- 2310 Cascade Dr
- 1780 Pine Forrest Dr
- 1790 Pine Forrest Dr
- 1780 Pine Forest Dr
- 1806 Pine Forrest Dr
- 0 Pine Forrest Dr Unit 5685786
- 0 Pine Forrest Dr Unit 8121023
- 1786 Pine Forrest Dr
- 1818 Pine Forrest Dr
- 1793 W Elmwood Dr
- 1781 W Elmwood Dr
- 1805 W Elmwood Dr
- 1811 Pine Forrest Dr
- 1791 Pine Forrest Dr
- 1769 W Elmwood Dr
- 1817 W Elmwood Dr
- 1767 Pine Forrest Dr
- 0 Pine Forest Dr Unit 7638952
- 5712 Oak Grove Dr
- 5728 Oak Grove Dr
- 5740 Oak Grove Dr