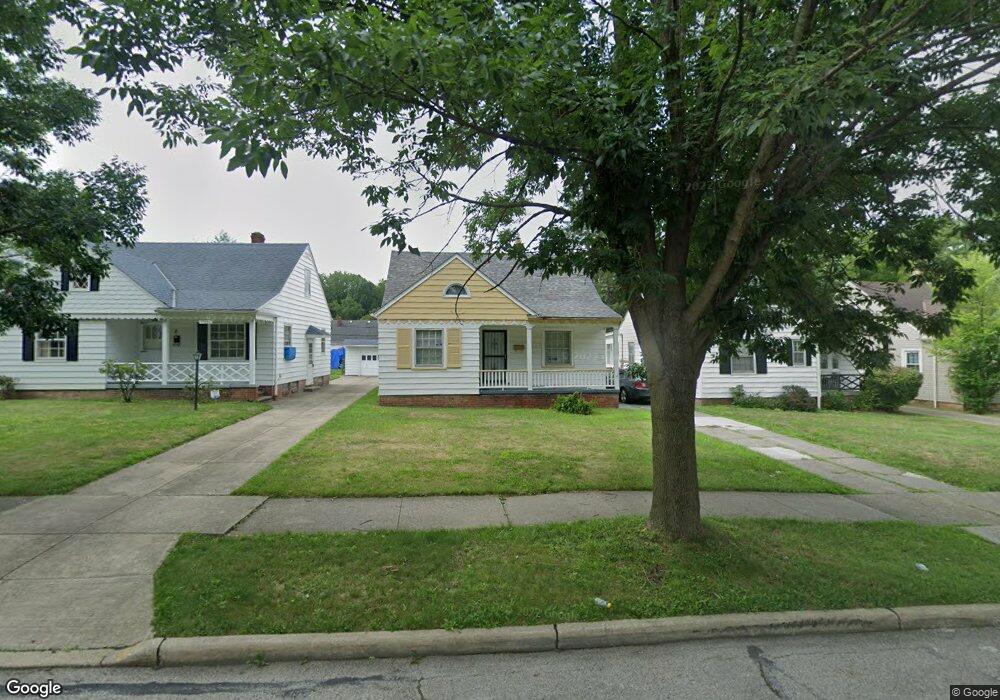
17800 Mapleboro Ave Maple Heights, OH 44137
Estimated Value: $101,000 - $140,000
3
Beds
2
Baths
788
Sq Ft
$149/Sq Ft
Est. Value
About This Home
This home is located at 17800 Mapleboro Ave, Maple Heights, OH 44137 and is currently estimated at $117,672, approximately $149 per square foot. 17800 Mapleboro Ave is a home located in Cuyahoga County with nearby schools including Abraham Lincoln Elementary School, Rockside/ J.F. Kennedy School, and Italy High School.
Ownership History
Date
Name
Owned For
Owner Type
Purchase Details
Closed on
Jul 3, 2017
Sold by
Anderson Kevin and Woods Cove Ii Llc
Bought by
Ogbn Investment Company Llc
Current Estimated Value
Purchase Details
Closed on
Nov 3, 2015
Sold by
Anderson Kevin
Bought by
Lakeside Reo Ventures Llc
Purchase Details
Closed on
Mar 1, 2000
Sold by
Berisko Raymond P and Berisko Nancy A
Bought by
Anderson Kevin and Anderson Diedra
Home Financials for this Owner
Home Financials are based on the most recent Mortgage that was taken out on this home.
Original Mortgage
$90,000
Interest Rate
8.27%
Purchase Details
Closed on
Oct 8, 1987
Sold by
Volny James
Bought by
Ceccardi Rita M
Purchase Details
Closed on
Mar 10, 1983
Sold by
Volny James and Volny Anna R
Bought by
Volny James
Purchase Details
Closed on
Jan 1, 1975
Bought by
Volny James and Volny Anna R
Create a Home Valuation Report for This Property
The Home Valuation Report is an in-depth analysis detailing your home's value as well as a comparison with similar homes in the area
Home Values in the Area
Average Home Value in this Area
Purchase History
| Date | Buyer | Sale Price | Title Company |
|---|---|---|---|
| Ogbn Investment Company Llc | $22,000 | None Available | |
| Lakeside Reo Ventures Llc | $23,846 | None Available | |
| Anderson Kevin | $75,000 | First Ohio Title Services In | |
| Ceccardi Rita M | $45,000 | -- | |
| Volny James | -- | -- | |
| Volny James | -- | -- |
Source: Public Records
Mortgage History
| Date | Status | Borrower | Loan Amount |
|---|---|---|---|
| Previous Owner | Anderson Kevin | $90,000 |
Source: Public Records
Tax History Compared to Growth
Tax History
| Year | Tax Paid | Tax Assessment Tax Assessment Total Assessment is a certain percentage of the fair market value that is determined by local assessors to be the total taxable value of land and additions on the property. | Land | Improvement |
|---|---|---|---|---|
| 2024 | $3,180 | $34,195 | $7,385 | $26,810 |
| 2023 | $2,625 | $24,290 | $5,250 | $19,040 |
| 2022 | $2,616 | $24,290 | $5,250 | $19,040 |
| 2021 | $2,792 | $24,290 | $5,250 | $19,040 |
| 2020 | $2,381 | $18,410 | $3,990 | $14,420 |
| 2019 | $2,769 | $52,600 | $11,400 | $41,200 |
| 2018 | $1,179 | $18,410 | $3,990 | $14,420 |
| 2017 | $2,372 | $18,130 | $5,180 | $12,950 |
| 2016 | $2,295 | $18,130 | $5,180 | $12,950 |
| 2015 | $4,895 | $18,130 | $5,180 | $12,950 |
| 2014 | $4,895 | $19,920 | $5,710 | $14,210 |
Source: Public Records
Map
Nearby Homes
- 5493 Thomas St
- 17806 Maple Heights Blvd
- 17912 North Blvd
- 17916 North Blvd
- 5425 Grasmere Ave
- 17204 Maple Heights Blvd
- 5540 Dalewood Ave
- 5615 South Blvd
- 5357 Beechwood Ave
- 5562 Dalewood Ave
- 5570 Dalewood Ave
- 5257 Philip Ave
- 5578 Dalewood Ave
- 5320 Clement Ave
- 5239 Arch St
- 5409 Hollywood Ave
- 5212 Catherine St
- 5231 Philip Ave
- 5234 Erwin St
- 18909 Maple Heights Blvd
- 17808 Mapleboro Ave
- 17708 Mapleboro Ave
- 17704 Mapleboro Rd
- 17816 Mapleboro Ave
- 17704 Mapleboro Ave
- 17900 Mapleboro Ave
- 17700 Mapleboro Ave
- 17809 Dalewood Ave
- 17805 Dalewood Ave
- 17813 Dalewood Ave
- 17908 Mapleboro Ave
- 17698 Mapleboro Ave
- 17801 Dalewood Ave
- 17817 Dalewood Ave
- 17809 Mapleboro Ave
- 17801 Mapleboro Ave
- 17817 Mapleboro Ave
- 18000 Mapleboro Ave
- 17821 Dalewood Ave
- 17694 Mapleboro Ave